8 Trading Tips That Can Transform Your Journey – From The Safe Trader Academy

Think of the stock market like a battlefield of emotion, self-discipline, and strategizing. Every trader walks in there hoping to find financial freedom, and only a few manage to do so in a consistent manner. Why? Because successful trading is not about being able to foresee the market; it is about managing your own conduct. At The Safe Trader Academy, we believe in empowering traders beyond tools and charts, providing them also with the mindset and discipline needed for success. Thus we gathered these eight essential points of advice-anyone serious about learning to trade must have them on hand to be fully reminded of them each and every day. Let’s take a look at these points and discuss how they apply to real-world trading: 1. Patience, Patience, Patience. If you ask any successful trader about his most important asset, he would say patience instead of fancy indicators. Waiting for the right setup can feel boring when the markets are moving fast. But trading is a game of precision, not speed. Impulsive entries are a sure way to burn your capital. With the benefit of being patient, you can ensure that you get in at good levels and always exit wisely. It puts you above FOMO (fear of missing out) and gives you the slight advantage that most traders lack. ✅ Tip: If you feel the urge to enter a trade without a solid reason, step back. Boredom should never lead to a trade. 2. Don’t Overtrade More trades ≠ more profits. Usually, overtrading occurs because of boredom, revenge, or overconfidence. Every trade should have a setup, a risk-reward ratio, and a reason for entering a trade. Think quality versus quantity. 💡 Analogy: A sniper takes one shot after hours of waiting; a machine gun sprays and prays. Be a sniper. 3. Only Take High-Quality Trades Every trade carries risk. Why risk your capital on a set-up that has a low probability of success? A high-quality trade is one that fits your strategy, market structure, time frame, and risk parameters. In other words, it is not just a trade to make money but to make smart trading decisions. Before you enter a trade, ask yourself the following questions: 4. Trade With Logic, Not Emotions Most losses don’t come from the market—they come from ourselves. Emotional states such as fear, greed, anger, or euphoria have the power to cloud one’s judgment. A trader must develop an unemotional approach to decision-making if he wants to succeed: trade with data, logic, and discipline. 🚫 Don’t: ✅ Do: 5. Don’t “Revenge Trade” After a Losing Streak Everyone loses. Even the best traders. How they handle it distinguishes them. Revenge trading — trying to win money back quickly — leads to bigger losses. It is emotional, irrational, and destructive. 📌 Rule: After 2 or 3 losses in a row, stop, review your trades and regain emotional control. 6. Don’t Become Overconfident After a Winning Streak Confidence is good. Overconfidence is dangerous. After a few wins, many traders go ahead and increase their lot sizes or worse, take some riskier entries and may even start ignoring their system for obvious reasons. That would be in the market coming down on them. Keep your feet on the ground. Be humble. 🧠 Reminder: A recent profit does not offer any guarantee about future profits. 7. Less Indicators, More Price Action You and I don’t need 10 indicators to analyze a chart. Too many indicators, actually, cause confusion and paralysis. Learn to read price action: candlesticks, support/resistance, trendlines, and volume. These are the languages of the market. ✅ Suggestion: Keep to 1 or 2 indicators that complement your price action thesis. Keep your charts clean. 8. Learn Something New Everyday The best traders are lifelong students. Markets change. New patterns emerge. Technology develops. Thus, learning should be set as a daily chore; read, watch, review, and reflect. Learning Ideas: Why Follow These Tips? Following these 8 trading principles can help you: Whether you’re day trading, swing trading, or investing, these tips will help you operate with clarity and confidence. Final Words: Trading is a Journey, Not a Sprint These tips are your daily compass, guiding you through the ups and downs of trading. Whether you’re just starting or have years of experience, these principles will help you build a strong, consistent, and professional trading routine. The Safe Trader Academy, with certified trainers and real-market exposure, is committed to helping you become a safe and confident trader.
Happiest Minds Breakout: The Calm Before a Big Rally?
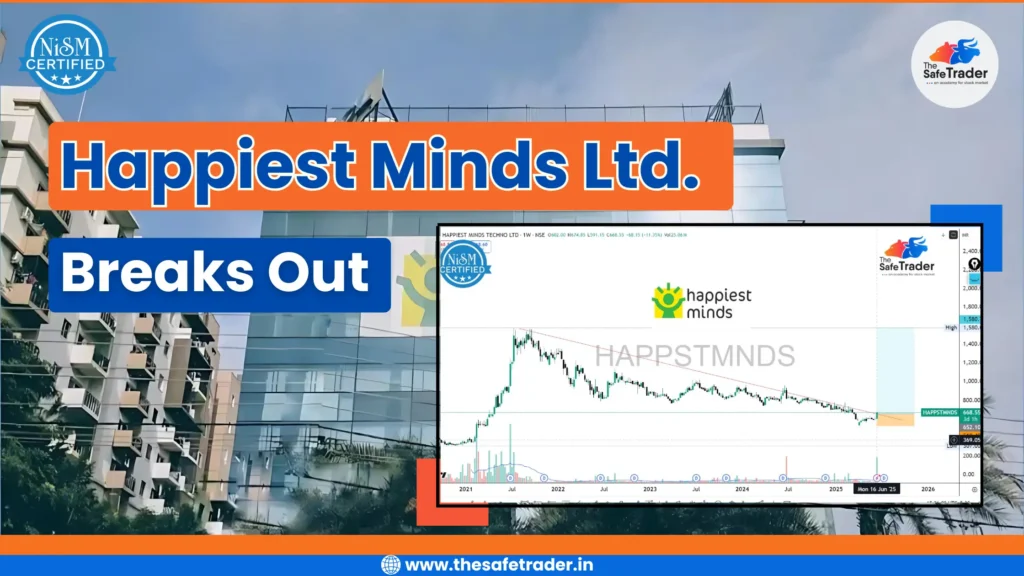
Introduction: Happiest Minds Technologies Ltd. (NSE: HAPPSTMNDS), a well-known mid-cap IT player, has been under the radar for the past couple of years due to its steep correction from all-time highs. But this week, a sudden 11.35% surge has turned all eyes back to this counter. Is this a technical breakout, or just another short-lived bounce? Let’s decode the price structure, volume action, and future prospects of this trending stock. A Silent Comeback in the Making? In a frequently hype-driven and herd-oriented market, opportunities do present themselves in stealth — including the Happiest Minds Technologies Ltd. (NSE: HAPPSTMNDS) share. After being battered by a prolonged downtrend lasting over three years, the stock has finally shown signs of life. The latest weekly candle tells a story of resurgence — a breakout backed by strong volume and a double-digit price move. Could this be the turning point? Let’s dive deeper. Historical Overview: Since Happiest Minds had gone public and made its debut on the primary stock market in 2020, it drew the investor’s eyes primarily for its digital-first IT service offering. Exploiting the tech boom, the price of this stock grew very quickly to around ₹1,580 by mid-2021. From hereon began a bearish trend for years, precipitated by: From its peaks at ₹1,580, the stock saw a plunge of over 75% to hit a lifetime low of ₹369 by early 2025 — really getting even the long-term investor-testing patience and conviction. The Fall from Grace: A Quick Recap For a time, Happiest Minds was a darling of the tech investors after the IPO boom. The new-age technology company was riding the wave of digital transformation to euphoric highs of ₹1,580 in 2021. But, as macro pressures, valuation concerns, and cheapest sector rotation started setting in, the stock fizzled out — losing over 75% of its value, hitting near its bottom at ₹369. This long and agonizing correction saw: Technical Chart Analysis The weekly chart is telling a totally different story — a reversal could be in play. Key Observations: Clean breakout above the long-term descending trendline, which is in existence since sometime mid-2021. This is the first weekly close above this trendline for nearly 3 years. Volume at the week stands at 25 million, much above the average, signifying strong institutional activity. The bounce happened from a major demand zone (₹600–₹650), showing interest of buyers at historical supports. RSI probably indicates a bullish turn-up with a move above 50, while MACD may soon look for a crossover if the momentum sustains. 📌 Breakout Zone: ₹660–₹675📌 Target Zone (Short-Term): ₹800–₹850📌 Major Resistance: ₹950 & ₹1,150📌 Stop-Loss for Traders: ₹620 (below trendline & base) Fundamental Perspective: Is the Business Still Strong? Despite the price erosion, Happiest Minds continues to be a profitable, cash-generating mid-cap IT player focused on digital services, AI, cloud, and product engineering. Fundamental Snapshot (FY24–25) While technicals are in focus, let’s not ignore the fundamentals: Metric Value Market Cap ₹9,700 Crores approx. PE Ratio 42x (post-correction) Revenue Growth (YoY) ~17% Net Profit Margin 20–21% Range Debt-Free Status ✅ Yes Despite the correction in price, the company remains fundamentally sound, with consistent growth in revenue and margins. It remains debt-free — a big positive in a rising interest rate environment. Market Sentiment: What Are Traders & Institutions Seeing? Positive Signals: Caution Flags: Verdict: A watch on the next 2 or 3 candles on a weekly chart might confirm whether momentum is sustainable. Outlook: Can Happiest Minds Reach ₹1,000+ Again? If technically the ₹800–₹850 barriers are swept away with conviction, the stock might go on to: Fundamentally, a revival of demand for digital transformation and AI-driven services could become the next catalyst. Bottom Line: If this indeed turns out to be a breakout with strong conviction, then Happiest Minds could be a journey towards four digits — but just onto market patience and proper risk management. Conclusion Happiest Minds Technologies seems to be at a conclusive turning point. The breakout witnessed recently, in conjunction with sound price action and volume, is an event that can never be ignored on the four-year-long downtrend. For the traders, it is the classic textbook breakout; for the investors, this could signal the beginning of a value-led recovery in the downtrodden but fundamentally promising IT stock. Zones of resistance like ₹750 and ₹850 will check the strength of this breakout, but under the current technical setup, momentum appears to be shifting. If there is a revival in the broader IT sector and a positive earnings performance, Happiest Minds may well get back to follow its bullish path. Always remember, success is built on discipline — enter smartly, manage risk, and protect your profits. Be it momentum trading or just believing long term in India’s digital growth story, Happiest Minds must feature on your portfolio radar for keen observation. Disclaimer:The information provided here is purely for educational and informational purposes only and reflects our personal analysis and opinions. We are not SEBI-registered advisors. Please consult a qualified financial advisor before making any investment decisions.
Kalyani Steels Breaks Out: Start of a New Bullish Trend?
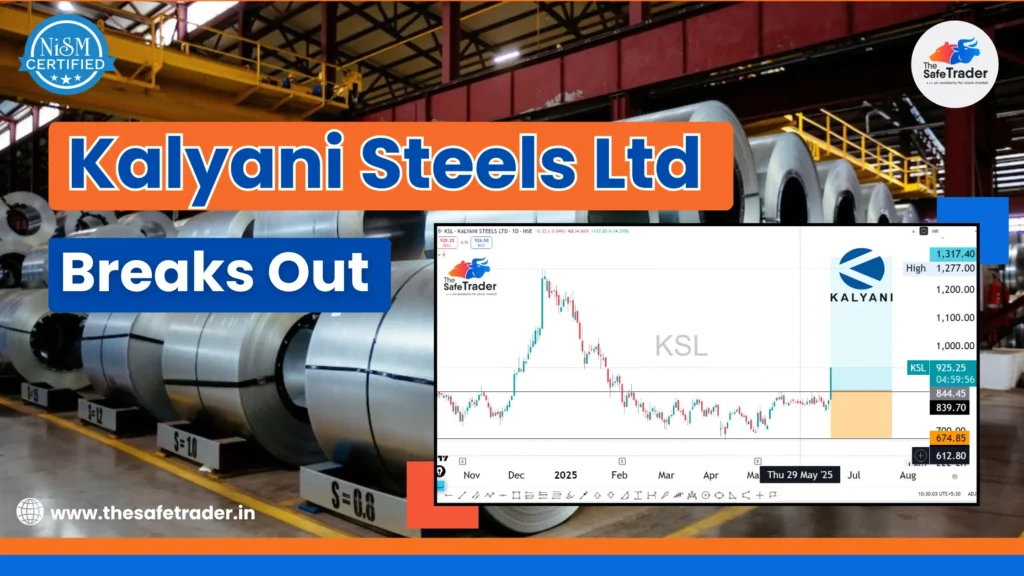
Introduction In a market where large-cap momentum has been grabbing headlines, mid-cap and small-cap stocks are quietly preparing for their next big move. One such stock making noise with its recent breakout is Kalyani Steels Ltd (KSL). After slipping sideways for months, Kalyani Steel Ltd has given bulls a reason to celebrate. On the 29th of May, 2025, the stock consumed a breakout above a very strong resistance level on huge volumes and bullish sentiment; this breakout shot the stock above 14.5% in a day and is now poised to mark the trend reversal, if not an all-out rally, in the coming months. But will the breakout remain sustained? Which price levels are of importance for the traders and investors to watch now? Let’s get into the technicals and payoff profiles along with alternate trade setups in KSL. Technical Picture – Breakout Confirmed The chart clearly shows that KSL has been consolidating between the ₹675 to ₹840 zone for over 4 months. This kind of long consolidation often precedes a strong directional move, and KSL has delivered just that. Key Technical Highlights: This is a classic breakout trade setup that fits well within a risk-managed strategy. Psychological Edge – Why This Matters Such breakouts after long-drawn consolidations typically denote a change in institutional behavior. The smart money tends to accumulate within sideways ranges, and momentum traders, retail participants, and algorithmic systems join the fray once a breakout occurs, hastening the price rally. The breakout seems more enticing, given its neat chart structure with a historical high zone at around ₹1,300, which is the new target. KSL: A Quick Fundamental Snapshot Kalyani Steels is a key player in the Indian alloy and special steel sector, supplying to automotive, engineering, and defense industries. India is currently emphasizing creating infrastructure, defense manufacturing, and ‘Make in India’–which means steel will see long-term demand. Recent triggers: These factors complement the bullish technical setup. Risk-Reward & Trade Planning Let’s lay out a potential trading plan for both swing and positional traders: Trade Element Value Entry Zone ₹920 – ₹940 Target 1 ₹1,277 Target 2 ₹1,317 Stop-Loss ₹674.85 Risk-Reward Ratio ~1:2.5 to 1:3 Note: Always manage position sizing based on risk tolerance. Do not chase after a gap-up; wait for pullbacks or consolidation near breakout zones. Trading Plan: How to Approach This Setup Let’s lay out a potential trading plan for both swing and positional traders: Strategy Type Entry Zone Target Zone Stop-Loss Swing Trading ₹915 – ₹935 ₹1,277 – ₹1,317 ₹675 Long-Term Investing On dips Above ₹1,300+ Below ₹650 Tips for Traders: ⚠️ Note: Always manage position sizing based on risk tolerance. Do not chase after a gap-up; wait for pullbacks or consolidation near breakout zones. Broader Market Context The breakout in Kalyani Steels occurs at a time when the metals sector is undergoing renewed strength with rising global demand and infrastructure push in India. If the Nifty Metal index continues to hold good, KSL can prove to be one of the best performers in the pack. Rising steel prices at the international level and government capex spending can help to sunset fundamentals. Why This Breakout Could Be Huge Final Views: A Trend in the Making? The breakout in Kalyani Steels Ltd is not just a technical event—it might be the beginning of a structural uptrend. While short-term volatility may persist, the broader trend looks upward. Traders and investors should keep this stock on their radar and watch for sustained momentum in the days to come. Disclaimer:The information provided here is purely for educational and informational purposes only and reflects our personal analysis and opinions. We are not SEBI-registered advisors. Please consult a qualified financial advisor before making any investment decisions.
Crude Oil Price on Fire: Nearly 37% in Just 39 Days

Crude oil prices have recently taken traders and investors by surprise with a stunning 36.93% rally in just over a month. From ₹4,724 on May 5, 2025, to ₹6,467 on June 13, 2025, MCX Crude Oil Futures surged nearly ₹1,744, delivering one of the most powerful commodity rallies seen in recent months. This upward price movement is more than just numbers on a chart; it is a shift in market sentiment, altered fundamentals, and greater speculative activity. If you are any trader, investor, or market watcher, then this move holds lessons for you in price action, global macro trends, and trading psychology. What Triggered the Spike in Crude Oil? 1. Middle East Geopolitical Tensions One of the main catalysts has been the escalating conflict between Israel and Iran. With the potential for disruptions in oil flow through the Strait of Hormuz — a key artery for global oil exports — traders and institutions rushed to hedge their positions, sending oil prices soaring. Fact: Nearly 30% of global crude oil passes through the Strait of Hormuz daily. Any instability here directly threatens global oil supply. 2. Restrained Supply-Restraint Factor on Price & OPEC+ Competition Demand is consistently higher, while OPEC+ units, showing production restraint, refuse to drain the markets at these higher prices. The unplanned production outages in Libya and Nigeria also negatively affect supply. 3. Seasonal Demand Surge The season of baby travel is soon upon us; hence higher gasoline and diesel consumption levels will be recorded. Refineries are now upping crude lifting to meet this seasonal demand, adding to the tight supply situation. 4. Speculative Buying & Technical Momentum The price action seen in this rally also reflects momentum-driven trading. Once crude broke past resistance levels, traders using technical indicators likely added fuel to the rally: Technical Analysis Breakdown From a chartist’s perspective, this rally is a textbook example of trend reversal and breakout momentum. Here’s the breakdown: Feature Detail Lowest Point ₹4,724 (on May 5, 2025) Highest Point ₹6,467 (on June 13, 2025) Total Gain ₹1,744 Percentage Gain 36.93% Trend Pattern V-shape recovery with higher highs & higher lows Volume Analysis Increasing volumes confirming bullish strength The breakout above previous resistance zones, followed by strong bullish candles, indicates high conviction buying in the market. Key Takeaways for Traders The price action considered offers more than just profits — it provides learning opportunities for both novice and seasoned traders. ✅ Trend Identification: Early signals of reversals, including rejection wicks and higher-low formations, were cautions for active traders. ✅ Breakout Confirmation: Once crude broke out of consolidation near ₹5,500, momentum buyers shone in glory. ✅ Risk-Reward Payoff: Entries at the very start of the trend brought huge returns with risk under control. 🔑 Remember: Every rally brings the opportunity to make money — or for money to be lost if there is a reversal. In such fast-moving markets, technical stop losses become a must. Conclusion: Will the Rally Sustain? Crude oil’s recent bullish trend reminds us that commodities are high-beta assets — capable of both explosive rallies and sharp corrections. Whether you’re a short-term trader or a long-term macro investor, keeping an eye on technical signals, global news, and market sentiment is crucial. As we move deeper into 2025, watch how inventory reports, geopolitical developments, and central bank policies impact energy prices. For now, the bulls are clearly in control — but always stay prepared for the unexpected in commodity markets. 👉 Join The Safe Trader Academy today and start trading like a pro.
Top Bitcoin Holders in the World (2025)

Bitcoin, the world’s first decentralized digital currency, has been around since 2009. From an experimental project, it imparted to existence as a global financial asset that individuals and institutions have gathered huge quantities of BTC; even if Bitcoin promotes decentralization, a few entities hold about a huge percent of the total supply. This blog explores the 10 largest Bitcoin holders worldwide as per the last publicly available data in 2025. 1. Satoshi Nakamoto – 1.1 Million BTC The anonymous creator of Bitcoin, called Satoshi Nakamoto, mined roughly 1.12 million BTC in the early days (2009-2010). These coins have never been moved, which really means it may have been an intentional act to promote Bitcoin decentralization. From a present value perspective, the BTC has an assumed worth of more than $70 billion and is distributed over ~22,000 addresses. Why it matters: The moment these coins are in recent times in motion, it can cause either massive loss of confidence or colossal volatility. 2. Coinbase (Exchange Wallets) – 1.05 Million BTC Coinbase, the largest U.S.-based crypto exchange, holds BTC in cold wallets on behalf of users. According to blockchain analytics, these wallets total around 1.05 million BTC. Note: These aren’t Coinbase’s proprietary assets but user-deposited funds. 3. Binance – 650k to 765k BTC Binance holds between 650,000–765,000 BTC in custody. Being the largest crypto exchange worldwide in trading volume, their reserves are spread over multiple wallets, and the actual holdings are published periodically in the transparency reports. Why it matters: The holdings of Binance represent a significant amount of global liquidity. 4. BlackRock (IBIT ETF) – 550k+ BTC In 2024, BlackRock launched iShares Bitcoin Trust (IBIT), igniting gigantic institutional interest. By mid-2025, the ETF held 550,000+ BTC, making it the largest holder in the spot ETF. Impact: Institutional adoption continues to impart legitimacy and stability to the market. 5. MicroStrategy – 499k BTC Under the Bitcoin bullish leadership of Michael Saylor, MicroStrategy has acquired nearly 499,000 BTC. The company still purchases Bitcoin as a treasury asset, supported by bonds and convertible notes. Implication: MicroStrategy is the largest public BTC holder as an instance of a Bitcoin-backed balance sheet. 6. Grayscale Bitcoin Trust (GBTC) – 220k BTC Once the dominant U.S. Bitcoin investment vehicle, Grayscale’s GBTC still holds around 220,000 BTC. Despite recent outflows due to ETF competition, GBTC remains a major player. Investor Note: Grayscale’s holdings are now more transparent, aligning with SEC ETF conversions. 7. U.S. Government – 213k BTC The U.S. government has seized BTC through law enforcement operations (Silk Road, Bitfinex hack, etc.). These assets are stored by the U.S. Marshals Service and sold via auctions, though a large amount remains unsold. Interesting Fact: The U.S. is now among the largest nation-state holders of Bitcoin. 8. Bitfinex – 359k BTC Bitfinex, one of the earliest and most influential exchanges, holds over 359,000 BTC in cold wallets. These holdings reflect both user balances and company reserves. Security Note: Despite a history of hacks, Bitfinex has since improved wallet transparency and multisig protocols. 9. Kraken – 237k BTC U.S.-based exchange Kraken stores around 237,000 BTC, primarily in cold storage for user assets. Known for compliance and transparency, Kraken is a major BTC custodian for U.S. customers. 10. Wrapped Bitcoin (WBTC) – 176k BTC WBTC is a tokenized form of BTC on Ethereum, fully backed 1:1 by Bitcoin. These tokens allow BTC holders to participate in DeFi. The reserve BTC is held by BitGo and verified via on-chain audits. Honorable Mentions Holder BTC Held Notes UK Government ~61k BTC Seized through criminal investigations. China Government ~194k BTC Confiscated from Ponzi schemes & illegal mining. North Korea (Lazarus) ~13.5k BTC Stolen by cyberattacks. Bhutan ~13k BTC Mined using hydroelectric energy. El Salvador ~6k BTC First country to adopt BTC as legal tender. How Many Bitcoins Are Left? As of 2025, approximately 1.3 million BTC remain to be mined, with the final BTC expected around 2140. A large chunk of coins (est. 3–4 million) are permanently lost due to lost keys or unspendable wallets—tightening overall supply. Bitcoin Distribution – Who Really Owns BTC? Final Thoughts: Why Bitcoin Distribution Matters Understanding who the largest holders of Bitcoin are lets us analyze considerations for liquidity into the market, a centralization risk, and some level of geopolitical interest. Be it the mad scientist of technology himself, Satoshi; a corporate strategist like Michael Saylor; or a government agency holding seized coins-the concentration of BTC directly affects: As Bitcoin grows up, transparent ownership and responsible custody will exert greater influence on its future. FAQs 1 Are these holdings public? Yes, the blockchain is transparent so analysts can verify wallet balances, though several wallet identities remain anonymous. 2 What happens if a government sells its Bitcoin? Such an event normally brings about temporary price dips as was experienced during the US Marshals auctions, but the markets absorb them pretty much quickly. 3 How does an ETF hold Bitcoins? An ETF purchases and stores BTC via a trusted custodian (e.g., Coinbase Custody) and then issues shares that are backed by real Bitcoin. 4 Is Satoshi’s Bitcoin lost? It is unclear. The Bitcoins haven’t moved for over a decade; however, from a technical perspective, they still can be moved if their private keys exist. 👉 Join The Safe Trader Academy today and start trading like a pro.
Bank Nifty Hits Record High: ₹57,049.50
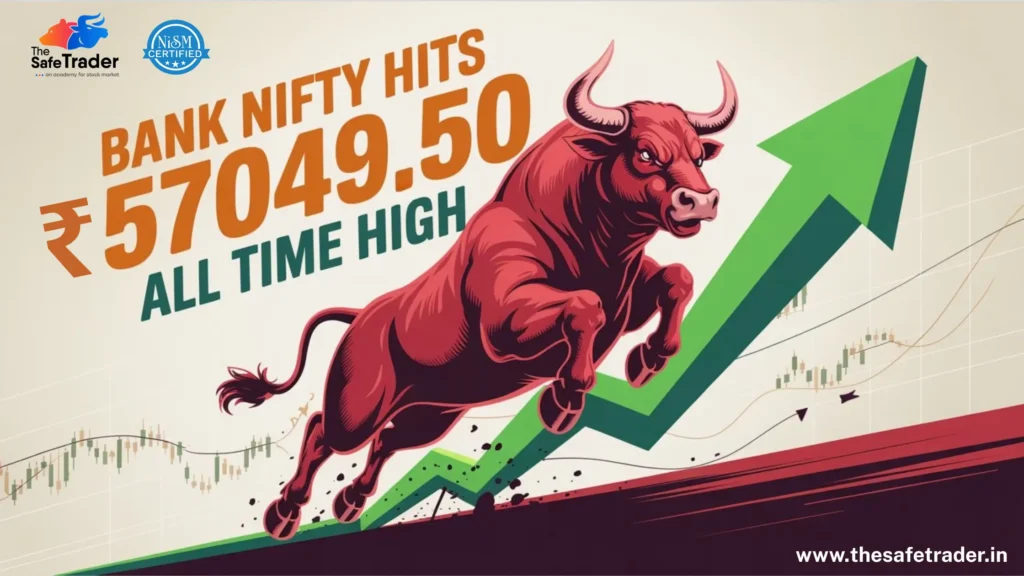
The Bank Nifty Index, India’s benchmark banking sector index, made headlines today by surging to a new all-time high of ₹57,049.50, supported by strong policy action from the Reserve Bank of India (RBI) and a sharp rebound in banking stocks. This milestone marks a significant shift in market sentiment, especially for financials that have been lagging behind tech and FMCG sectors over the past year. Let’s break down what led to this breakout, what it means for market participants, and how you can position yourself accordingly. RBI’s Liquidity Push: The Catalyst Behind the Rally The RBI’s recent surprise moves have played a central role: Liquidity-enhancing measures through these twin policy tools are the RBI’s way to provide some short-term stimulus to growth while continuing to invest in inflation control measures in the long run. Sector-Wise Breakdown: Bank Stocks on Fire Here’s how key banking players moved in today’s session: Bank Name Price Change Reason for Movement Kotak Mahindra +2.1% Strong credit growth forecast, lower CoF Canara Bank +2.7% PSU banking rally + robust NIM projections Axis Bank +1.9% Attracted fresh FII inflows PNB +3.4% Mid-cap PSU favorite, under-ownership lifted AU Small Finance +2.3% Benefit from micro-loan demand surge ICICI Bank -0.2% Slight correction after recent rally Technical Analysis: Breakout or Bull Trap? 👉 Pro tip to traders: A trailing stop-loss can be placed below support to ride the momentum while protecting profits. Market Sentiment & Institutional Support 🔍 FII & DII Action: 🧭 Sentiment Drivers: A Quick Flashback: Bank Nifty’s Journey Year Bank Nifty Approx Level Key Events 2020 ~20,000 COVID-19 crash 2021 ~36,000 Economic recovery begins 2022 ~41,000 High inflation, rising interest rates 2023 ~44,000 Banking earnings strengthen 2024 ~51,000 Pre-election rally 2025 ₹57,049.50 Record high post-election + RBI policy support Macro Trends Supporting the Rally What This Means for Stakeholders ✅ For Traders: ✅ For Long-Term Investors: ✅ For Portfolio Managers: Conclusion: The Bull Is Back in Banking The all-time high of ₹57,049.50 isn’t just a number — it signals that India’s banking system is entering a new growth phase, backed by: With macroeconomic conditions favouring a pro-liquidity environment, the banking sector may continue to outperform — potentially leading the broader market rally for the rest of 2025. FAQs Q1. Why did Bank Nifty hit an all-time high today? ➡ Due to the RBI’s surprise repo rate and CRR cuts, improving liquidity, reducing bank funding costs, and triggering a buying spree in banking stocks. Q2. What is the next target for Bank Nifty? ➡ Technically, ₹58,500 is the next resistance. Above that, ₹60,000 is possible in the coming weeks if the uptrend holds. Q3. Is this a good time to invest in banking stocks? ➡ For long-term investors: yes, selectively. Look for banks with solid fundamentals and good digital transformation metrics. Q4. What risks could pull Bank Nifty down? ➡ Global uncertainty, unexpected inflation spikes, or RBI tightening in future if inflation flares up again. Q5. Which banks are top picks post this breakout? ➡ ICICI Bank, HDFC Bank, Canara Bank, Kotak Mahindra, and AU Small Finance Bank. 👉 Join The Safe Trader Academy today and start trading like a pro.
STOCK MARKET ANALYSIS
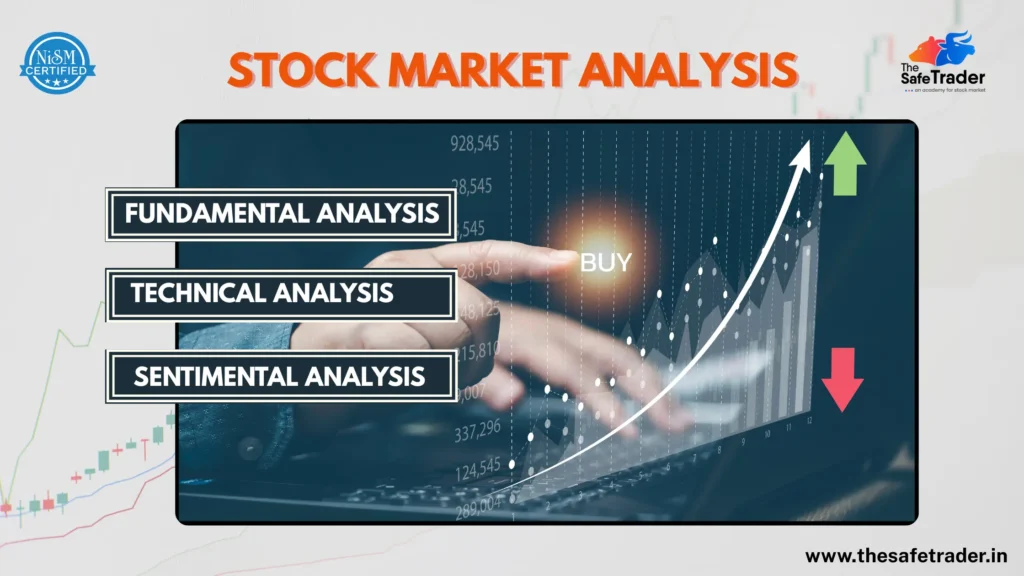
The stock market is a complex and dynamic system influenced by multiple factors. To succeed in it, traders and investors must understand how to analyze stocks from various perspectives. Traditionally, there are three main types of analysis used in the stock market: Each plays a different role in your decision-making process. Some market experts, like Mallinath Mulage ,CEO of The Safe Trader Academy Hyderabad, believe that while all three are essential, their weight and importance vary depending on the trading style. According to him: 1. Fundamental Analysis: Laying the Foundation Fundamental analysis focuses on evaluating the intrinsic value of a company. It answers the question: “Is this a good business to invest in?” This would help long-term investors who are not concerned about daily price movements but are concerned about whether the company is financially sound and will be able to grow in the long run. What Does It Include? Example: Suppose, for instance, you are evaluating ITC Ltd. Through fundamental analysis, “Fundamentals help you select the right stock, but they won’t tell you the right time to buy it.” Tip: Use fundamentals to shortlist strong companies in booming sectors like banking, IT, or energy before digging into technical charts. 2. Technical Analysis: Timing the Market Once you’ve got a fundamentally sound stock, the question is—when to buy it and when to let go of it? That’s where Technical Analysis comes in. Technical analysis considers price action, volume, and market patterns to decide the best entry price or the best time to exit a trade. According to Mallinath Mulage, 90% of the stock market decisions are pegged on technicals, especially in the case of traders and short-term investors. What Does It Focus On? Technical analysis reads in the minds of the market. It does not care about a company’s profits- it cares about what the market thinks will happen next. Example: Say you have identified Reliance Industries as a fundamentally strong stock. Should you buy it today, next week, or wait for a cheaper price? Technical analysis will help you determine: “An excellent stock could still make you lose money if your timing is wrong.” Tip: Always trade with the trend; minimize your risk by trading close to S/R zones and moving averages for better profit realization. 3. Sentimental Analysis: Reading the Market’s Mood At times, even seemingly robust stocks plummet with a single negative headline. And this is where Sentimental Analysis comes into the picture. Sentimental analysis seeks to gauge how traders and investors feel about the general market or individual stocks. They are often influenced by factors external to the companies and thus may not always reflect fundamentals. Market behavior is ruled by emotion. What Influences Market Sentiment? It’s many times that we see the markets moving on feelings and not on facts. For instance, the announcement of a much better earnings report can still result in a decline of the stock price if the investor was expecting an even bigger profit. Tip: Tools like the Fear & Greed Index, news aggregators, or economic calendars come in handy to keep sentiments in check. An early shift in sentiment will always prove to be an early indication for reversals. Mallinath Mulage, CEO of The Safe Trader Academy, an experienced stock market mentor, said, “Fundamental Analysis plays 10% role while Technical Analysis plays 90% role in trading success.” When combined wisely, these three create a powerful strategy for anyone trading the markets. Why You Need All Three While each analysis serves a purpose, using them together provides a well-rounded strategy: Type of Analysis Role It Plays Best For Fundamental Analysis Stock and sector selection Long-term investing Technical Analysis Timing entry and exit Short- to medium-term Sentimental Analysis Understanding market mood and volatility News-based movement ✅ Successful traders know when to mix logic, emotion, and timing. Practical Tips to Apply These Analyses Conclusion: Successful trading and investing is not about predicting the future—it’s about preparing for it using every tool available. Each type of analysis is a piece of the puzzle, and when combined, they provide clarity in the often-chaotic world of trading. FAQs: 1. Can I rely only on Technical Analysis? A: For intraday and short-term trades, technicals are crucial. But combining them with sentiment increases your edge. Q2. Is Fundamental Analysis only for long-term investors? A: Primarily yes, but even short-term traders use fundamentals to avoid weak or scammy stocks. Q3. How often should I do Sentiment Analysis? A: Daily. Market mood can change overnight based on global events or economic data. Q4. Which one should beginners focus on first? A: Start with basic fundamental concepts, then dive into technical. Learn sentiment as you gain experience. 👉 Join The Safe Trader Academy today and start trading like a pro.
Celebrating 24 Years of Nifty50 : A Journey of Growth and Innovation
The National Stock Exchange of India (NSE) marked a significant milestone on June 4, 2025, celebrating 24 years since the launch of index options on the Nifty50 Index. Launched on June 4, 2001, the Nifty50 index options paved the way for robust derivatives trading in India, bringing new opportunities for investors and traders to manage risk and generate returns. A Look Back: The Beginning of Nifty50 Index Options On June 4, 2001, NSE initiated the trading of index options, more specifically on the Nifty50 Index. This had been one giant leap for the Indian capital markets, empowering the market participants with an awesome hedge tool against the risks and to speculate on the broader market movements. From then on, the Nifty50 index options have tremendously grown in popularity to become one of the important players in the Indian derivatives market. Expanding the Options Universe: Beyond Nifty 50 Having acknowledged the varied needs of market participants, NSE has, with time, enriched its Index Options offering. Presently, Index Options are available on five key indices, each serving a separate sector and market segment: ✅ Nifty 50: Neighborhood’s foremost index representing the top 50 blue-chip companies. ✅ Nifty Bank: Indian banking and financial sector companies of the highest order. ✅ Nifty Next 50: Constituted by the next 50 large-cap stocks outside the Nifty 50 for growth prospects. ✅ Nifty Midcap Select: Exposure to mid-cap companies, in between large and small firms. ✅ Nifty Financial Services: Targets the vibrant financial services sector of India, including NBFCs and insurance. With such expansion, it ensures that traders have more opportunities to engage in India’s dynamic markets across various sectors and market capitalizations. 📘 Nifty 50 Stocks List (2025) Stock Name Stock Name Stock Name Stock Name Stock Name ADANIENT GRASIM NESTLEIND TATASTEEL APOLLOHOSP ADANIPORTS HCLTECH NTPC TCS ASIANPAINT AXISBANK HDFCBANK ONGC TECHM BAJAJ-AUTO BAJFINANCE HDFCLIFE POWERGRID TITAN BAJAJFINSV BPCL HEROMOTOCO RELIANCE ULTRACEMCO BHARTIARTL BRITANNIA HINDALCO SBILIFE UPL CIPLA COALINDIA HINDUNILVR SBIN WIPRO DIVISLAB DRREDDY ICICIBANK SHREECEM LTIM EICHERMOT INDUSINDBK INFY SIEMENS LTI ITC JSWSTEEL KOTAKBANK M&M TATACONSUM MARUTI Diverse Contract Tenures for Flexibility A strength of NSE derivative markets is flexibility. Trading starts on Fridays and closes on Thursdays for all Index Options contracts to ease risk management for traders. The NSE has various tenures for each strategy: These multivariate tenures allow traders to finely manage their positions, modify strategies, and mitigate risks. Global Recognition for NSE Adding to its achievements, NSE has been recognized globally as the World’s Largest Derivatives Exchange for the 6th consecutive year in 2024, based on the number of contracts traded. This recognition underscores NSE’s leadership in providing transparent, efficient, and innovative trading infrastructure to participants worldwide. Why the Nifty50 Index Matters The Nifty50 is India’s country’s benchmark stock market index and represents the first 50 large-cap companies listed on the NSE. It spans several sectors such as banking, IT, energy, FMCG, etc. Being considered a barometer of economic India, it is closely followed by investors, traders, and policymakers. Due to its high liquidity, the index is a favorite for trading of derivatives in futures and options. Nifty50, with a track record of centuries, with a high amount of participation remains an important instrument for risk management and opportunity leverage in India’s dynamic market. Benefits of Trading Index Options Diversification & Hedging Possibilities: An index option provides the investor or trader an opportunity to hedge the whole portfolio or a sector-specific basket against any adverse market movement. Lower Margin Requirements: Traditionally, lower margins are assigned to index options as compared to those on single stocks, thus marketing them to a broader audience. High Liquidity: The Nifty50 options segment practically assures liquidity, making it easy for investors to enter and exit trades. Risk Management & Flexibility: Index options are good tools to manage market-wide risk. They are flexible tools that can be employed in numerous strategies: income generation, hedging, or taking directional bets. FAQs Q: When do index options expire? Why are they made to expire on Thursdays? A: NSE standardized index options to expire on Thursdays for consistency and to provide better planning to traders. If Thursday turns out to be a holiday, the expiry takes place the previous trading day. Q. How relevant is being recognized worldwide by the NSE? A: Holding the position of the largest derivatives exchange worldwide for six years consecutively brings forth the image of an NSE that leads in transparency and is trusted by the market. Q: How do index options offer protection for new traders? A: Index options offer a safer starting place for new traders because they tend to be less volatile than single-stock options and allow one to diversify. Final Thoughts As NSE celebrates 24 years of Nifty50 index options trading, it’s clear that the exchange has played a transformative role in India’s capital markets. With cutting-edge infrastructure, robust risk management systems, and a growing suite of index options, NSE continues to be the cornerstone for Indian investors and traders. Whether you’re a beginner exploring index options or a seasoned trader refining your strategies, the Nifty50 and other index options offer immense potential. Let’s look forward to many more years of growth, learning, and opportunities! 👉 Join The Safe Trader Academy today and start trading like a pro.
Mastering Trading Psychology: The Secret Weapon of Profitable Traders

Introduction To most people, traders who trade successfully are associated with complicated algorithms, powerful trading platforms, or insider knowledge. Although some of these things might be a factor, it is probably not the least commonly accepted secret weapon that consistently profitable traders wield—trading psychology. Mastering one’s mind is more important than mastering any chart pattern or indicator. In actuality, it is the ability to control emotions and maintain mental discipline with every single decision which separates the winners from the losers in the long-term view. At The Safe Trader Academy in Hyderabad, we teach our students that mastering the mind is even more important than mastering the market. In this blog, we will discover how emotions like fear, greed, overconfidence, and doubt hinder traders and how they can work on conditioning the mind to trade professionally. What Is Trading Psychology? Trading psychology is the set of emotions and mental states that influence the decisions made by a trader. It consists of fear, greed, hope, overconfidence, discipline, patience, and regret. Unlike technical analysis or fundamental analysis, trading psychology deals with how you react to market behavior rather than with what the market actually does. It affects heavily when and how you: Two big emotions in trading are: Understanding these emotions—and how to control them—is key to becoming a successful trader. Top 7 Psychological Mistakes Traders Make 1️⃣ Fear of Losing 2️⃣ Overtrading 3️⃣ Lack of Discipline 4️⃣Chasing the Market (FOMO) 5️⃣ Greed 6️⃣Ignoring Mental Health 7️⃣Lack of Self-Awareness 5 Ways to Build a Winning Trading Mindset ✅ 1. Create Your Trading Plan Outline your: If you have a clear plan, emotional decisions won’t interfere. ✅ 2. Record Every Trade Track: This approach achieves more self-awareness and faster learning. ✅ 3. Visualization & Affirmations Now, use positive self-talk to reprogram your trading mindset: ✅ 4. Simulate High-Stress Scenarios Use stressful demos like extremely fast markets or drawdowns to condition your emotional responses so that you don’t crumble under pressure. ✅5. Join a Trading Community Being part of a like-minded tribe like The Safe Trader Academy offers: Why Most Traders Fail: It’s Not the Strategy, It’s the Psychology The stock market is full of traders who know what to do but fail to do that at the right moment. Why should that be? Because psychology gets in the way. Fear wins over logic. Greed drowns out the voice of caution. Doubt makes that person hesitate to act. A dangerously inflated ego will just push the limit beyond what should have been. A trader’s worst enemy isn’t the market — it’s often themselves. The Role of Subconscious Beliefs in Trading Your beliefs about money, success, and failure impact your trading performance far more than you realize. If you subconsciously believe: …you will sabotage your own trades, no matter how good your setup or system is. That’s why mental reprogramming techniques — affirmations, journaling, and subconscious rewiring — are critical parts of our Trading Psychology Course at The Safe Trader Academy. Real Success Comes from Emotional Control A trader with an average strategy but strong psychology will consistently outperform a trader with a brilliant strategy and a weak mindset. Controlling emotions isn’t optional—it’s the key to consistency and long-term profits. Why Most Traders Fail — And How You Can Avoid It Let’s be honest — 95% of traders lose money. But it’s not because they didn’t learn candlestick patterns. It’s because they: The 5% who succeed?They treat trading like a mental sport — where emotions are trained, not ignored. Why Choose The Safe Trader Academy for Trading Psychology? At The Safe Trader Academy, we do more than teach setups. We train the mind behind the trades. Every course includes: Conclusion: Mind Over Markets Mastering trading psychology is not a one-time achievement—it’s an ongoing process of self-awareness and discipline. The best traders treat their mindset like a muscle: they train it daily, evaluate it regularly, and protect it fiercely. Remember, the market doesn’t control your success—you do.And the real edge is not in the market, but in how you think, feel, and act within it. 👉 Join The Safe Trader Academy today and start trading like a pro.
Intraday Trading: 10 Essential Strategies for Consistent Profits
Introduction: The process of Intraday Trading involves the acquisition and sale of stocks or indices within the same trading day. Hence, it offers an opportunity for daily income. Without the proper approach, many traders battle inconsistent results and long strings of losses. At The Safe Trader Academy, Hyderabad, we have empowered more than 3,000 students to confidently navigate the fast-paced world of intraday trading. In this blog, we will look at 10 important concepts that professional intraday traders use to make sure they remain consistently profitable. Get ready for that intraday upgrade. Let’s dive in! What is Intraday Trading? Intraday trading, thus sometimes referred to as day trading, has to do with opening and closing property during a trading session. Unlike in swing or positional trading, intraday traders try to derive profits from short-term price movements that happen during the day. Quick facts about intraday trading: ✅ Positions closed before market close – no risk at night. ✅ Traders rely mainly on technical analysis and short-term trend analysis. ✅ Highly liquid stocks and indices, such as Nifty and Bank Nifty, are preferred. ✅ Must adhere to a disciplined risk management system in order to avoid any large drawdowns. 10 Proven Intraday Trading Techniques 1️⃣ Opening Range Breakout Strategy One of the best-loved strategies for active traders is the Opening Range Breakout. It involves watching the market for 15 minutes (from 9:15 AM to 9:30 AM in India). How it goes: 🔹 Mark the high and low of this opening range. 🔹 Price breaking above the high on strength of volume would mean a bullish breakout. 🔹 Price breaking below the low would mean a bearish breakout. 🔹 Confirming indicators like VWAP or volume spike could give greater reliability. Pro tip: Run your trades on Bank Nifty or stocks with high liquidity to get the best results from this strategy. 2️⃣ VWAP Reversion Strategy The Volume Weighted Average Price (VWAP) is a rather popular indicator used in the institutional realm to denote the arithmetic average price weighted by volume through the trading session. How to use VWAP: ✅ Buy on dips to the VWAP line in an uptrend. ✅ Sell on rallies to the VWAP line in a downtrend. ✅ VWAP acts as dynamic support/resistance during the session as well. This strategy is perfect for entering pullbacks with really tight risk-just the way professional day traders love it. 3️⃣ The EMA Crossover Entry The Exponential Moving Average (EMA) crossover is a classic strategy for capturing short-term trends. How it works: 🔸 Use the 9 EMA as the fast one and the 21 EMA as the slow one. 🔸 When the 9 EMA crosses over the 21 EMA and price moves higher, it becomes a bullish signal. 🔸 When the 9 EMA crosses below the 21 EMA, it becomes a bearish one. 🔸 Use momentum indicators like MACD or RSI to confirm and eliminate false signals. It is good for momentum trades and trending markets! 4️⃣ Support-Resistance Flip Support and resistance zones formed during the previous trading day prove to be critical levels for intraday traders. How to use it: ✅ Mark levels like PDH (Previous Day High), PDL (Previous Day Low), and POC (Point of Control). ✅ When the price breaks these levels and retests them, they usually flip from support to resistance or vice versa. ✅ Use candlestick patterns for confirmation (pin bar, engulfing candle). This simple but extremely effective method facilitates detecting intraday reversal and breakout trades on a higher probability basis. 5️⃣ Momentum Scalping Strategy For traders who love fast action, momentum scalping is a go-to approach. How to execute: 🔹 Use the screener tools at your disposal, such as Finviz, TradingView, or your broker’s scanner, to find high-volume stocks attached to news catalysts or with a strong pre-market move. 🔹 Buy on breakout candles alongside volume confirmation. 🔹 Take profits quickly while targeting a quick reward-to-risk ratio of 1:1 or 1:2. 🔹 Exit quickly as momentum hardly lasts! Scalping techniques for intraday trades are best for snagging any small moves in the market without watching the market get choppy. 6️⃣ Breakout-Retest Confirmation Do you want to know why some breakouts fail? They do breakouts without much conviction. Hence, one should consider waiting for a retest following the breakout level. How to perform: ✅ Let price break above (below) a key level first. ✅ Wait for it to retest that level-it tells if the breakout is genuine. ✅ Enter upon confirmation of the retest with a tight stop loss. ✅ Works well on Nifty BankNifty futures, especially when trading with institutional momentum. 7️⃣ Relative Strength (RS) – Intraday Picks Different stocks move differently for the markets. There lies some relative strength against the broader markets. How to trade RS: 🔹 If the Nifty remains flat and a stock like Reliance shows buying momentum breaking highs, just pay attention to that stock. 🔹 If, on the other hand, Nifty is heading lower whereas a stock seems to be holding on strong, go for that outperformer. 🔹 Perform scans on RS or intraday watchlist to look for these outperformers. This helps in filtering out those stocks which can do better in anybody’s market. 8️⃣ News-Driven Scalps The news Intraday moves fast! From directly breaking news of RBI policy changes, corporate earnings, or global headline news – any news that triggers volatility can present opportunities for quick profits. Key pointers: ✅ Stick to liquid, high-beta stocks or indices reacting to news. ✅ Immediate breakout trades with tight stop-losses only – the news volatility may suddenly reverse. ✅ Do not hold news trades for long – go for quick scalps only. 9️⃣ Gap Trading for Intraday Gaps caused by pre-market moves or global news can result in one of the largest intraday moves. How to approach gaps: 🔹 Use pre-market data and global cues to identify potential gap-ups or gap-downs. 🔹 After 15 minutes, check if the price continues in the gap direction or starts to reverse. 🔹 Example: Infosys gaps