Dow Jones Industrial Average: A Trader’s Guide to US30 Weightage
The Dow Jones Industrial Average (DJIA), popularly known as the Dow or US30 on various trading platforms, is certainly one of the most iconic and widely recognized indices among traders. Nonetheless, many traders will admit to not having the slightest idea of how the index works or of how the movement of an individual stock would affect the index. This is all the more crucial to day traders, swing traders, and position traders who use technical or fundamental strategies based on the Dow movement. This blog will explain exactly what Dow really means, how stocks are weighted, and what this means for a trader trying to build an edge. What is the Dow Jones? The Dow Jones Industrial Average, or simply the “Dow,” was created in 1896 by Charles Dow and Edward Jones. It initially comprised just 12 companies, evolving over time into a 30-stock index supposedly meant to represent the broader U.S. industrial economy—yet ironically, not many today are really industrial companies. The DJIA is often referenced as an indicator of general market sentiment and economic health. Blue-chip stocks are included from sectors like technology, healthcare, finance, consumer goods, among others. Quick facts about the Dow Jones: The Dow does not track the overall market like the S&P 500, rather, it cherry-picks the cream of the crop blue-chip companies that are deemed leaders in their industry and considered stable with consistent performance. Price-Weighted: What Makes It Different Most modern-day indices are market-cap weighted, implying that the larger the company, the more influential it is. The Dow, though, is price-weighted, and thus the more expensive a stock, the more it moves the index; the market capitalization of the company is irrelevant here. Example: UnitedHealth (UNH) at $500 can move certain levels in the Dow that Apple (AAPL) at $180 cannot, even though Apple is 3 times bigger in terms of market cap. A 1% move in the price of UNH shares will have a lot more effect on the index than a 1% move in CSCO or INTC. This can cause distortion. A $10 increase in UNH price would add around 70 points to Dow, whereas a similar $10 increase in AAPL price adds only ~36 points. Top 10 Weighted Stocks in the Dow (2025) Below are the most influential components of the Dow based on recent price data (as of May 2025). Keep in mind these weights change slightly with price fluctuations: Rank Company Ticker Price (Approx.) Influence (Weight %) 1 UnitedHealth Group UNH $500 ~9.5% 2 Microsoft MSFT $420 ~8.2% 3 Goldman Sachs GS $370 ~7.3% 4 Home Depot HD $330 ~6.5% 5 McDonald’s MCD $290 ~5.7% 6 Amgen AMGN $270 ~5.3% 7 Caterpillar CAT $260 ~5.1% 8 Apple AAPL $180 ~3.5% 9 Boeing BA $170 ~3.3% 10 IBM IBM $160 ~3.1% Trading Implications of Price Weighting If you engage in Dow (US30) futures or CFDs, including options, knowing price-based weighting is crucial for risk management and strategy formulation. Traders’ Opportunities: Earnings Season: Focus on high-priced stocks like UNH, GS, or MSFT; unexpected events can sway the Dow quite significantly. News Catalysts: One upgrade or downgrade to a high-weight stock sends the entire index in one direction or the other. Correlation Tracking: Occasionally, the Dow rises with some 20 stocks down, just because a few of them are heavily weighted in the index. Risks and Misinterpretations: A Sector Breakdown of the Dow It boasts a variety of companies from a spectrum of industries, some sectors are more represented than others. As of 2025, here is a rough breakdown: Technology: Apple, Microsoft, Intel, IBM, Salesforce, and Cisco Healthcare: UnitedHealth, Johnson & Johnson, Amgen, and Merck Financials: Goldman Sachs, JPMorgan Chase, and American Express Industrials: Boeing, Caterpillar, 3M, and Honeywell Consumer: McDonald’s, Walmart, Procter & Gamble, Nike, and Coca-Cola Note: The Dow has far lesser exposure to technology than the Nasdaq-100, and this directly affects how the index reacts to tech-sector volatility. Some Key Takeaways For Traders and Investors Useful Tools for Dow/US30 Traders Some tools and resources useful for following and analyzing the US30: Final Thoughts Even though Dow Jones looks like a simple index, under its unique price-weighted design lie certain opportunities and pitfalls. Hence an individual trader or investor would have to gain an understanding of what stocks actually drive the Dow’s movement for a piece of constrained market awareness. The US30 continues to retain favor with the intraday and swing traders, being affected by volatility, liquidity, and the psychological factor of world finance. Just make sure you don’t treat it like one other index-because it isn’t. Want to Know More Details, Please Click Here
Understanding the Bombay Stock Exchange: A Beginner’s Guide
BSE, the first-ever stock exchange in Asia, was established in 1875. It is also the first in the country to be granted permanent recognition under the Securities Contract Regulation Act, 1956. It is the Fastest Stock Exchange in the world with a speed of 6 microseconds and is one of India’s leading exchange groups. In 1986, the Co-developed the S&P BSE SENSEX index, giving the Co. a means to measure the overall performance of the exchange. In 2017, it became the first listed stock exchange in India. About BSE Bombay Stock Exchange (BSE Ltd) is an Indian Stock Exchange located at Dalal Street in Mumbai. The Co. facilitates a market for trading in equity, currencies, debt instruments, derivatives, and mutual funds. BSE Ltd. Stock Pros Debt-Free company Strong Quarterly Outlook Solid Growth in Profits Good Dividend Payout BSE Ltd. Stock Cons High Valuation Peer Comparison for BSE: It compares BSE with other companies belonging to the same niche-i.e., financial services. BSE takes the lead in all the important key statistics: BSE Financial Highlights 1. Revenue Growth 2. Operating Performance 3. Net Profit & EPS 4. Exceptional Quarter – June 2023 5. The Leveraging in Action Profit & Loss statement of a BSE from FY 2014 to FY 2025 The stock has done really well, giving 137% returns in the past one year alone and 120% CAGR over 5 years. BSE Balance Sheet Analysis (Mar 2014 – Mar 2025) Strong Asset Build-up: Steady Increase in Reserves: Debt-Free: Being Operation-Linked, Other Liabilities Rise: Good Investment Portfolio: Growth in Infrastructure: Financially Sound and Low-Risk: Cash Flows and Ratios of BSE Ltd. Cash Flows (₹ in Crores) Cash Flows (₹ in Crores) Cash From Operating Activities: Cash From Investing Activities: Cash From Financing Activities: Net Cash Flow: Key Financial Ratios Shareholding Pattern for a BSE Ltd: Conclusion The Bombay Stock Exchange did stretch its arms far from its humble 19th-century beginnings. Today it plays the important role of raising capital, offering investment opportunities, and serving as the economic barometer. The trick of the trade here is that whether you are an inexperienced investor or an experienced trader, knowing how BSE operates will empower you with tools and know-how to pursue the opportunities in India’s dynamic financial landscape. As India proceeds forward to become one of the largest economies in the world the future of BSE will remain full of opportunities for innovation, investment, and economic development. Want to Know More Details, Please Click Here
Ku Coin BTC Reserves Collapse 77% as 14K Coins Flee — Is a Liquidity Squeeze Looming?
This week, the Cryptocurrency world was shaken after a series of data revealed massive Bitcoin outflows from KuCoin. During the recent days, over 14,000 BTC have reportedly been withdrawn from the exchange, bringing about a 77% decline in its Bitcoin reserves. This development has provoked concerns about a possible liquidity crisis and, hence, uncontrolled questions about user trust, regulatory pressure, and the bearing on centralized exchanges at large. What Triggered the Mass Exodus? Reserves of KuCoin have sharply declined after the exchange’s rough phase. KuCoin was charged, earlier in 2024, by the U.S. Department of Justice for allegedly failing to maintain an effective anti-money laundering program. Apart from being subject to such legal risk, however, regulators began regulating centralized platforms with a tighter grip, and users began thinking hard about where to put their assets. What happened, as a result? A withdrawal wave, especially from the institution and long-term holders. On-chain data states that the packet of KuCoin BTC reserves plummeted from about 18,000 BTC to below 4,000 BTC, while it was at its lowest level in many years. A Crisis of Confidence? While KuCoin maintains that operations remain normal, if there is so much BTC leaking out, then there’s something wrong. The users seem to have begun doubting the platform’s ability to handle risk, uphold security for the funds, and act in accordance with global regulations. This resembles what has happened during other exchange collapses, most famously the case of FTX in 2022, where the reserve drain came to fore as an early indicator of liquidity woes. Nothing so far points straight to KuCoin being insolvent; however, as it stands, the situation is unsettling enough to disturb investors. The Liquidity Squeeze Scenario At present, KuCoin finds itself bearing a real threat of liquidity strain in times of market volatility and hence, less BTC on hand. Suppose fast price surges or price drops hit Bitcoin markets and rushes users to withdraw; then handling orders or withdrawing processing quickly may become an issue for the exchange. This gets worse if the exchange depends on borrowed liquidity or settlement on a time lag. In times even worse, from a bad-case perspective, we could experience: Self-Custody on the Rise The KuCoin affair is just one member of a much larger client consciousness: a shift toward self-custody. As users get more acquainted with the risks associated with central exchanges, they have started increasing the adoption of hardware wallets and decentralized platforms. While blockchain is built on trustless systems, centralized platforms instill a single point of failure. Events like this act as an acceleration toward a more decentralized future, where users can control their assets and reduce counterparty risk. What to Watch Next For investors and traders, this is a crucial time to stay alert. Here’s what to monitor: Final Thoughts That 77% collapse of KuCoin’s BTC reserves should not merely be taken as a headline but should be viewed as a red flag. Given the present state of affairs (whether it is the beginning of a broader liquidity crisis or simply some kind of user-driven shift toward self-custody), it again stands as a reminder to crypto holders about the number one rule: “Not your keys, not your coins.” As usual, research hard, stay informed, and don’t ever leave more funds in an exchange than you are willing to lose. Want to Know More Details, Please Click Here
Forex Trading for Beginners: A Step-by-Step Guide to Start Safely in India

The Global Forex Market offers exciting opportunities to trade major currencies and profit from exchange rate movements. But if you’re a beginner in India, entering the world of forex trading can feel overwhelming—especially with legal regulations and risks involved. This blog is your step-by-step guide to understand forex trading and start your journey safely and legally within India’s regulatory framework. What Is Forex Trading? Forex trading, also known as currency trading, is the simultaneous buying of one currency and selling of another. Currencies are traded in pairs, such as USD/INR or EUR/USD. The objective of a forex trader is to earn a profit by predicting the fluctuations in exchange rates. For example: Traders use various tools and strategies to predict currency price movements, including technical analysis and fundamental factors such as interest rates, inflation, and global geopolitical events. Is Forex Trading Legal in India? Yes, But With Conditions, The Reserve Bank of India (RBI) and the Securities and Exchange Board of India (SEBI) allow Indian residents to trade currency derivatives only on SEBI-registered Indian exchanges such as: – NSE (National Stock Exchange) – BSE (Bombay Stock Exchange) – MCX-SX Only four currency pairs that are INR-based are permitted for trading on these exchanges: – USD/INR – EUR/INR – GBP/INR – JPY/INR ⚠️ Warning: Trading forex pairs without INR (like EUR/USD or GBP/JPY) through foreign brokers is prohibited under the FEMA Act for retail investors in India. Heavy punishments can be imposed on offenders. Step-by-Step Guide to Start Forex Trading in India Step 1: Learn the Basics of Forex Trading Before you begin trading, it’s crucial to understand the following: Step 2: Choose a SEBI-Registered Broker You will need a reliable forex broker to execute your trades. Look for brokers that are regulated by SEBI and provide trading on Indian exchanges like NSE or BSE. Ensure that they offer the currency pairs you wish to trade (USD/INR, EUR/INR, etc.). Step 3: Open a Demat Account To trade forex on Indian exchanges, you need to open a Demat account. A Demat account is necessary to hold your financial assets in electronic form and facilitate the buying and selling of currency derivatives. Looking to open a Demat account? You can easily open a PUPrime Demat Account using our link, and get support to guide you through the entire process, ensuring you start on the right track. Step 4: Practice with a Demo Account Start paper trading by practicing on a demo account to: Backing yourself with virtual funds is the need of the hour before laying real money. Step 5: Fund Your Trading Account Fund your trading account/linking your bank account for this purpose once you are ready for live trading in the market. Keep a small amount to trade with (1,000 to 5,000 rupees) just to safeguard against loss during your learning process. Step 6: Initiate Your First Trade Trade in 100 per currency pair, for example, USD/INR…Choose if you want to buy or sell this currency pair depending on your analysis. Check out the key factors to consider: – Lot size: Minimum contract value of currency futures is US$1,000. – Margins: Margin of around 3-5 percent of the value of trade is required to be deposited by the broker. – Expiry: Just like with stock derivatives, currency contracts expire on a monthly basis. Step 7: Begin With Your Risk Management Forex trading success is all over making money, but protecting capital is just as important. Always: – Use a stop loss to limit your losses – Risk no more than 1-2% of your capital on any single trade – Refrain from emotional or revenge trading Get it? Benefits of Forex Trading in India Risks You Should Know Why Choose The Safe Trader? At The Safe Trader, we prioritize your safety and success in the forex market. Our team offers personalized trading guidance, real-time signal alerts, and custom strategy sessions tailored to your goals. We help you navigate the market confidently with risk management tools and continuous support, ensuring you’re never trading blindly. Join us to trade smarter, not riskier. Final Thoughts Forex trading can be a profitable and intellectually rewarding journey—but only if approached with knowledge, discipline, and legal compliance. For Indian residents, it’s crucial to trade only on recognized exchanges and platforms that deal in INR-based currency pairs. Let The Safe Trader guide you toward a safe, smart, and successful trading journey. Call to Action: Ready to begin? Contact us today to book your free consultation or join our Telegram community for daily trading insights. FAQs: Forex Trading for Beginners in India Q1. Can I trade forex legally in India? A: Yes, but only INR-based pairs (like USD/INR) via SEBI-regulated platforms. Q2. Can I use foreign brokers to trade EUR/USD or GBP/USD? A: No, it’s illegal for retail investors under FEMA rules. Q3. Is forex trading risky? A: Yes, like all trading, it involves risk. Leverage and market volatility can lead to losses. Q4. How much money do I need to start? A: You can start with as little as ₹1,000–₹5,000 depending on the broker and margin requirements. Q5. Can I trade forex on weekends? A: No, forex markets are closed on weekends. Trading happens Monday to Friday. Q6. How do I learn more? A: Join our Free Trading Orientation or contact us directly at www.thesafetraderacademy.com. Looking to Open a PU Prime Account? ✅ Get started today with The Safe Trader Academy 📈 Open PU Prime Account:https://in.puprime.com/forex-trading-account/?affid=60590 📈 Verify Your Account:Make sure to complete all necessary verification steps to ensure your account is active and compliant with regulations. You need Aadhar Card & Bank Statement. 📊 Download MT4 Android Apphttps://drive.google.com/file/d/1-_tRSHoX6BSUmCDkJCOhOSUT3E1na_pq/view?usp=sharing 📊 Download MT5 Android Apphttps://drive.google.com/file/d/1YTzaNHhNgWmhKdx5XcgmQLR7bHyJqxfq/view?usp=sharing 📞 Call/WhatsApp Now: +91 9297506666 Start Your Forex Journey with Us! 🚀
Exploring List of Stock Exchanges in India: Cash and Commodity Exchanges

India’s financial systems are powered by strong, well-established exchanges where millions of transactions take place daily. These markets go all the way from stocks to agricultural produce and from retail investors to institutional giants, providing an organized platform of investment, hedging, speculation, and price discovery. This blog dissects the two major pillars of India’s exchange infrastructure-Cash Market (Equity Market) and Commodity Market-wherein the leading exchanges are highlighted as operating within each segment. Cash Market: The Foundation of Equity Investment Cash markets or equity spot markets are those where securities say stocks are exchanged for immediate delivery. In the cash market, ownership of shares is transferred and the payment is settled within a very short duration, normally T+1, where T is the date of the transaction. Cash market transactions are important for the long-term creation of wealth by providing an opportunity to invest in companies, earn dividends in return, and strengthen the portfolio. National Stock Exchange (NSE) Website: nseindia.com Inaugurated: 1992 Market Cap: Among the top exchanges in the world Key Index: Nifty 50 The NSE revolutionized Indian capital markets by introducing an electronic limit order book (LOB) trading system. With a focus on automation, transparency, and investor protection, NSE quickly became India’s largest stock exchange. Key Features: Products Traded on NSE: Nifty 50 index is a measure of India’s economic health, and tracks the top 50 companies across critical sectors. BSE (Bombay Stock Exchange): Products Traded on NSE: Nifty 50 index is a measure of India’s economic health, and tracks the top 50 companies across critical sectors. BSE (Bombay Stock Exchange): Website: bseindia.com Founded: 1875 (Oldest in Asia) Key Index: SENSEX BSE was formed in a time when trading was being held under a Banyan tree in Mumbai, today it has risen to become one of the fastest stock exchanges in the world with a transaction speed of 6 microseconds. Key Features: Key Offerings: SENSEX index representing 30 companies is measuring the mood of investors and 30 companies, representing India’s most-established blue-chip companies. Commodity Market: Trading Real-World Assets In commodity markets, the drama is all about the trading of raw or primary products, ranging from a commodity as cheap as grains and spices to metals and energy. Commodities are thus filled with price volatility for producers, manufacturers, and investors as one way to exploit trading opportunities. In India, two leading commodities exchanges are as follows: Multi Commodity Exchange (MCX) Website: mcxindia.com Founded: 2003 Regulated by: SEBI MCX holds the largest share in commodity trading in India. Price discovery and liquidity are considered efficient in metal and energy contracts. Popular Commodities on MCX: Precious metals: Gold, Silver Base metals: Copper, Zinc, Lead, Nickel, Aluminium Energy: Crude Oil, Natural Gas MCX helps businesses and speculators manage risk from globally traded commodities. National Commodity and Derivatives Exchange (NCDEX) Website: ncdex.com Founded: 2003 Headquarters: Mumbai NCDEX specializes in agriculture-linked commodities and offers a transparent platform connecting farmers with processors, traders, and exporters. Traded Commodities: NCDEX plays a key role in agricultural price risk management and – thus allows participants to lock in prices in advance through futures contracts. GIFT Nifty: Bridging Indian Markets with Global Investors GIFT Nifty – Traded via NSE International Exchange (NSE IX) GIFT Nifty is part of India’s broader plan to internationalize its financial services through GIFT City, Gujarat’s International Financial Services Centre (IFSC). It allows global investors to trade Indian index derivatives in USD. What Makes GIFT Nifty Different? Feature NSE/BSE GIFT Nifty (NSE IX) Currency INR USD Trading Hours 9:15 AM – 3:30 PM IST Two sessions: 6:30 AM – 2:30 PM & 3:30 PM – 11:30 PM IST Location India GIFT City (Offshore IFSC) Participants Domestic Investors Global Investors GIFT Nifty Products: Why It Matters: Metropolitan Stock Exchange of India (MSE) It is one of the three stock exchanges recognized by Indian law, the other two being NSE and BSE. MSE was brought into being to increase competition and innovation in Indian financial markets and provides a trading platform for equity, equity derivatives, debt instruments, and currency derivatives. Overview Website: www.msei.in Incorporation: 2008 Regulated by: Securities and Exchange Board of India (SEBI) Headquarters: Mumbai, India MSE has come into being to provide a modern and technology-driven trading environment to a wide market base and market participants. Even though it has relatively small trading volumes, MSE plays an integral part in bridging the financial markets, especially for those underserved populations such as Small and Medium Enterprises (SMEs) and regional investors. Key Offerings Equity Segment: Shares are traded concerning listed companies. MSE is promoting the listing of SMEs and startups so that an entrepreneurial growth environment flourishes. Equity Derivatives: Futures and options are based on both indices as well as individual stocks. Currency Derivatives: Contract in USD/INR, EUR/INR, GBP/INR, and JPY/INR. Change block type or style Move Heading block from position 78 up to position 77 Move Heading block from position 78 down to position 79 Change alignment Change text alignment Displays more block tools Exploring List of Stock Exchanges in India: Cash and Commodity Exchanges India’s financial systems are powered by strong, well-established exchanges where millions of transactions take place daily. These markets go all the way from stocks to agricultural produce and from retail investors to institutional giants, providing an organized platform of investment, hedging, speculation, and price discovery. This blog dissects the two major pillars of India’s exchange infrastructure-Cash Market (Equity Market) and Commodity Market-wherein the leading exchanges are highlighted as operating within each segment. Cash Market: The Foundation of Equity Investment Cash markets or equity spot markets are those where securities say stocks are exchanged for immediate delivery. In the cash market, ownership of shares is transferred and the payment is settled within a very short duration, normally T+1, where T is the date of the transaction. Cash market transactions are important for the long-term creation of wealth by providing an opportunity to invest in companies, earn dividends in return, and strengthen the portfolio. National Stock Exchange (NSE) Website: nseindia.com Inaugurated: 1992 Market Cap:
The Ultimate Guide for Derivatives: Futures and Options Trading

Introduction In derivatives trading, stock price changes are profit-making opportunities for the investors without them ever physically owning the stocks. It is a market that provides itself to risk management or making quick bucks. As of March 2025, the National Stock Exchange (NSE) contains 217 stocks in the Futures and Options (F&O) list. This proliferation manifests the growing importance of derivatives in the Indian market. Understanding futures and options is the key for traders and investors to survive in this highly competitive environment. The market activities are heavily regulated by SEBI, which promotes fair trading and transparency. Understanding Derivatives: An Introduction What Are Derivatives? Derivatives are financial contracts whose value varies with the price of some other asset, such as stocks. They are used either to protect investments or to make profits by betting on price moves. The principal types are futures, options, and swaps. These help traders to avoid risks or speculate on price changes without taking ownership of the actual asset. The Role of SEBI in Derivatives Trading SEBI, the Securities and Exchange Board of India, is the regulator for all derivatives trades. It formulates rules and regulations to keep the market safe and transparent. SEBI, in 2025, gave new directions for making the market more stable and less subject to manipulation while also protecting investors. These included tightening margin and trading limits. Benefits of Trading Futures and Options Futures and options offer many advantages to investors. They protect against losses(i.e., hedging). Speculators use futures and options to increase profits from small initial investments. Other derivatives help the discovery of fair stock prices and add transparency to the market. Exploring Different Types of Futures Contracts In the Indian financial markets, futures contracts are available across multiple asset classes — stocks, indices, commodities, and currencies. Understanding each type is crucial for traders and investors looking to diversify their strategies. Stock Futures Standardized: a contract between the two persons in which they determine the specific quantity of the stock to buy or sell at the predetermined future date for a particular price. At present, March 2025, 217 of the stocks in the Indian stock market are recognized for trading in F&O in NSE. This is further classified into different sectors, for example, banking, IT, automobiles, pharmaceutical sectors, etc. Example Companies Available for Stock Futures Trading: Company Name NSE Symbol Sector Reliance Industries Limited RELIANCE Energy/Conglomerate Infosys Limited INFY Information Technology HDFC Bank Limited HDFCBANK Banking Tata Consultancy Services TCS Information Technology ICICI Bank Limited ICICIBANK Banking Bharti Airtel Limited BHARTIARTL Telecom Larsen & Toubro Limited LT Engineering & Construction Bajaj Finance Limited BAJFINANCE NBFC (Financial Services) Key Features: Lot Size: Like all stock futures, all stocks have a defined lot size. For example, Reliance has 250 in the lot size where 250 shares constitute one lot. Margin Requirement: The trader must pay the initial margin amount which is generally 20-25% of the entire value of contract in trade. Settlement: Cash-settled on expiry of contract, which means no delivery of shares. 📌Stock Futures serves the purpose of Hedging towards individual stock positions or leveraged exposure into stock movement. 2. Index Futures Contracts based on an index rather than individual stocks are called index futures. These contracts provide wider market exposure with highly liquidity. Popular Index Futures on NSE: Index Name Description NIFTY 50 India’s flagship index comprising 50 major companies across sectors. BANKNIFTY Covers 12 of the most liquid and large-cap banking stocks. FINNIFTY Represents the diversified financial services sector (banks, NBFCs, insurance). MIDCPNIFTY Focuses on mid-cap companies. Popular Index Futures on BSE: Index Future Description S&P BSE SENSEX Futures Futures contract based on BSE’s 30 largest and most traded stocks. S&P BSE BANKEX Futures Futures contract tracking major banking sector companies on BSE. S&P BSE SENSEX 50 Futures Futures based on the top 50 companies listed on the BSE exchange. S&P BSE Bharat 22 Index Futures Futures based on a diversified basket of 22 Public Sector Enterprises (PSEs). S&P BSE 100 Futures Futures tracking the top 100 listed companies for broader market exposure. Key Features: Diversification: One index future represents a portfolio of stocks. Low Volatility: Compared to single stocks. Cash Settlement: No delivery of stocks at expiry — cash-settled based on index closing value. 📌 Index Futures work best for traders having a view on the general market or sector movement rather than on particular companies. 3. Commodity Futures Commodity Futures allow trading in essential goods like metals, energy products, and agricultural produce. In India, commodity futures are primarily traded on the Multi Commodity Exchange (MCX). Major Commodity Futures: Commodity Description GOLD A traditional safe-haven asset, ideal during economic uncertainty. SILVER Industrial and investment demand makes silver highly volatile. ZINC Widely used for galvanizing steel to prevent corrosion. COPPER Essential for construction, electronics, and manufacturing industries. CRUDE OIL Vital for the global economy; sensitive to geopolitical events. Key Features: 📌 Commodity Futures are useful for both hedging and speculation based on global supply-demand dynamics. 4. Currency Futures Currency Futures help traders hedge against currency risk or speculate on forex movements. These are traded on platforms like the NSE and BSE in India. Popular Currency Futures Pairs: Currency Pair Description USDINR U.S. Dollar against Indian Rupee. EURINR Euro against Indian Rupee. JPYINR Japanese Yen against Indian Rupee. GBPINR British Pound against Indian Rupee. Key Features: 📌 Currency Futures are essential for exporters, importers, and global investors managing foreign exchange risks. Options Trading: Deep Dive What Are Options and Types of Them Options give traders the right but not the obligation to buy or sell an underlying stock at a specific price before expiration. Options can either be exercised before expiry for example, American options, or at expiry only for example, European options. How Options Trading Operates Options can either be in-the-money (making money), at-the-money, or out-of-the-money. Pros and Cons of Options Trading They can be used to hedge or speculate. The losses will never exceed the premium paid. However, there is a risk of losing the premium if the
The Power of Asset Classes in Building Your Financial Future

An Asset Class in the Indian stock market (and in general investing) means a group of investments that behave similarly. Each asset class has its own risk and return profile. When people invest, they usually diversify across asset classes to balance risk. In the Indian context, the major asset classes are: 1. Equity (Stocks) 2. Debt (Fixed Income Instruments) 3. Mutual Funds: 4. Derivatives: 5. Commodities: 6. Real Estate Investment Trusts (REITs): 7. Infrastructure Investment Trusts (InvITs) : 8. Exchange-Traded Funds (ETFs) : 9. Currency: Asset Classes With Examples Conclusion Understanding the different asset classes helps you build a stronger, more balanced portfolio. Stocks, bonds, real estate, commodities, and alternatives each serve unique purposes. Your best strategy involves mixing them according to your goals and comfort with risk. Keep reviewing your investments regularly to stay aligned with market trends and your financial situation. Smart diversifying isn’t just a buzzword—it’s your ticket to better long-term success. For More Details, Click Here
BSE SURGES 80% IN 45 DAYS: Is This the Start of a Multi-Year Rally?
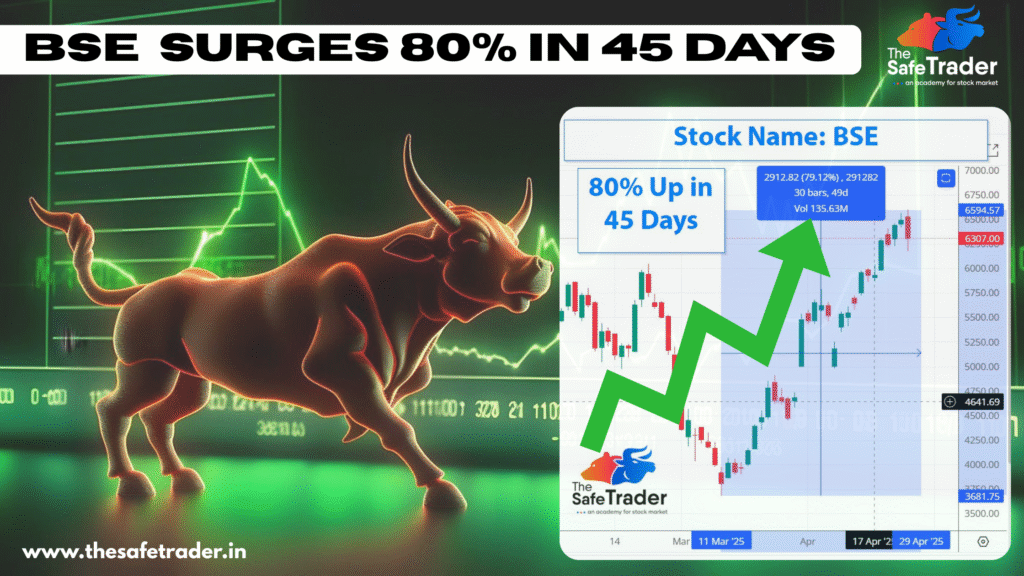
In a remarkable turn of events, BSE Ltd., Asia’s oldest stock exchange, has witnessed an impressive 80% surge in its stock price over the past 45 days. This significant uptick has caught the attention of investors and market analysts alike. About BSE Ltd : Established in 1875, BSE Ltd. (formerly Bombay Stock Exchange) is a premier stock exchange in India. Beyond facilitating equity trading, BSE offers services in derivatives, mutual funds, and SME platforms, playing a pivotal role in India’s financial ecosystem. Recent Stock Performance This surge is particularly noteworthy given the broader market dynamics and BSE’s historical performance. Factors Behind the 80% Rally The stock of BSE Ltd. has shown commendable performance on all counts due to the following factors: 1. Record High Trading Volumes Increase in participation in the Indian stock market; more retail investors in the fray. Increase in trading volume directly benefited BSE through transaction fees. 2. Growth in Derivatives Segment BSE’s strategic focus on expanding derivatives offerings, especially index options and futures, is starting to pay dividends as it attracts an even wider investor base. 3. Success of the SME Platform The BSE SME platform has become a preferred choice for small and medium enterprises that run after acquiring public listings. This would have brought in extra revenue for the settlement. 4. Technological Advancements Investment in technology has certainly benefited BSE in enhancing trading infrastructure providing speed with reliability, which drew due participants. 5. Positive Market Sentiment General bullish sentiment prevailing in the Indian equity markets has continued to spill over into stocks with a focus on financial infrastructure, making BSE Ltd. richer by value. Stock Performance Snapshots BSE Ltd. stock has gained about 80% till April 25, 2025, in the last 45 days. The appreciation reflects the fundamentals of the company and development perception of the investors on the financial sector in India. Investment Considerations With the recent rally showing strong legs, potential investors should consider the following: Valuation Metrics: Assess if the current stock price reflects the company’s earnings growth prospects. Market Competition: Understand BSE-specific competition issues relative to the National Stock Exchange (NSE). Regulatory Environment: Check for any regulatory changes that may impact the exchange operation. Technological Disruption: Follow technologies to watch out for that may disrupt trading platforms or affect investor behaviour. Conclusion The BSE Ltd. 80% appreciation in 45 days underscores the volatility of the Indian financial markets and the pivotal role of the exchange therein. While the prospects seem bright, the investor should conduct proper due diligence, considering both the opportunity and possible risks attached to a rapid surge in price.
Understanding Stock Analysis — Overvalued, Undervalued, and Fairly Valued Stocks

If you’ve ever thought about investing in the stock market, you’ve probably heard the term stock analysis. It sounds technical, maybe even intimidating—but it doesn’t have to be. In fact, learning how to analyze stocks is one of the smartest moves any investor can make. What is Stock Analysis? Stock analysis is described as the process by which the earnings, management ability, and performance of a company are taken into consideration to determine whether it would be a good investment proposition. Each analysis project sets out to find out if the stock is In general, there are two major forms of stock analysis: 1. Fundamental Analysis This type aims mainly at the study of financial statements, business model, industry, and economic front of the company. The question is whether this is a strong company to consider investing in for the long haul. 2. Technical Analysis This form analyzes price changes, trading volume, and formations on various charts. It’s more of a question of timing; you want the entry and exit points of your transactions to follow the prevailing trend of the marketplace. What is an Overvalued Stock? A stock is said to be overvalued if the share price exceeds the intrinsic value, which is justifiable only by certain fundamental factors such as earnings, revenue, or growth prospects. This situation may have arisen due to speculation, hype, or simply unreasonably optimistic expectations from investors. Overvaluation can be defined simply as a price higher than a value derived for the company valuation, and this may inject uncertainty into the situation if the share price adjusts with time to reflect its actual value. How to Analyze Overvalued Stocks: This is how one can detect and assess a stock is overvalued, through real data-driven analysis: 1. Look at P/E Ratio (Price-to-Earnings) Formula: P/E = Share price ÷ Earnings per share The high P/E means the market expects a lot of future growth. But when growth doesn’t happen, the stock collapses. Example: If a company had a P/E of 100, it means investors pay 100 dollars for every dollar earned currently. That is a steep bet. 2. Check the PEG Ratio (Price/Earnings to Growth) Formula: PEG = (P/E) ÷ Annual EPS Growth Rate A PEG over 1.0 often signals overvaluation. Example: If a stock has a P/E of 60 and expected growth of 20%, the PEG is 3. That’s considered overpriced. 3. Compare Price-to-Book (P/B) and Price-to-Sales (P/S) This is how much a shareholder pays on an average for a possible future payback on the company’s assets and sales. High P/B = paying more than the company’s asset value while high P/S = paying more than the company earns in revenue. Value investing usually goes for lower figures. Unless in a very high-growth industry. 4. Track Revenue and Earnings Growth Look at past performance and forward guidance. Warning signs: 5. Insider Trading Scenario Selling major blocks of a company’s stock by insiders is really worth checking out because it may mean that they think there is something unmanageable about the current price. Intelligent Money Advice: Use tools like Yahoo Finance, OpenInsider, or Finviz to track insider actions. 6. Compare with Industry Peers: Is the company an outlier with its valuation? Example: If a streaming company has a P/E of 90 while comparison companies at 20-30, demand a reason why. 7. Discounted Cash Flow (DCF) Analysis: This is the gold standard to determine how true the price of a stock really is. It forecasts cash flows into the future and discounts them to the amount today. If the stock trades far higher than your DCF estimate, it is probably overvalued. What is an Undervalued Stock? An Undervalued Stock, it is defined as a stock that is considered to trade at lower than its intrinsic value; in other words, a value below that which the market feels is correct. So Why does it Happen? How to Analyze Undervalued Stocks (Step-by-Step) 1. Compare PE with Industry Average The formula is P/E = Share Price/Earnings Per Share (EPS) If the P/E ratio is lower than average, it might be undervalued. But check whether earnings are stable or growing. For example: A company having a P/E of 9 and its industry average is 18 can be seen as undervalued, but only if the fundamentals are strong. 2. Look at the PEG Ratio Formula: PEG = P/E divided by Expected Earnings Growth A PEG smaller than 1.0 is generally an indication of undervaluation. A cheap stock in relation to its expected growth. 3. Check the Price-to-Book (P/B) Ratio Formula: P/B = Share Price ÷ Book Value per Share When the P/B ratio is less than 1, you’re spending less than the company’s net asset value. You can find it especially useful for banks or real estate companies. A company with a book value of $20 per share has a market trade price of $15. There you can get notice of a possible bargain. 4. Study the Price-to-Sales (P/S) Ratio Formula: P/S = Market Cap ÷ Revenue A low P/S ratio (generally less than 1) suggests that such stock prices have an undervalued nature. This comes into play when a company shows above-average sales performance but poor short-term profits due to high one-time expenditures. 5. Analyze Free Cash Flow Free Cash Flow (FCF) refers to the extra cash generated by a company after all the expenses have been paid off. High performance in FCF implies that a company can do To invest at a low price with positive FCF, well, this can be a good mix for sure. 6. Look for Temporary Problems Most common temporary problems for undermine stock: The key question is, short-term hick-up or long-term problems? Assuming the business fundamentals remain firm, it could be just a small dip hence a great buy. 7. Use Discounted Cash Flow (DCF) Analysis It is a very advanced but powerful technique employing forecasting of future cash flows to evaluate the actual worth of a stock. If the market price is much
Understanding the Risk-Reward Ratio in the Stock Market: A Guide for Smarter Trading

Probably the key concept that an investor or trader needs to comprehend is the Risk-Reward Ratio (RRR). This method can either make or break an investor, whether he has been in the business for years or just entering it. One really knows the RRR to sway his success and decision-making in the financial markets. What Is the Risk-Reward Ratio? The risk-reward ratio (RRR) is a measure that compares the potential profit of a trade to the potential loss. It helps investors and traders evaluate whether a trade is worth taking. Formula: For example, if you are willing to risk $100 for a potential profit of $300, the risk-reward ratio is: This means for every dollar you risk, you stand to gain three. Why Is It Important? How Indian Traders Use the Risk Reward Ratio Let’s take a real-world-style example from the Indian markets: Risk = ₹500 – ₹450 = ₹50Reward = ₹650 – ₹500 = ₹150 You’re risking ₹50 for the chance to make ₹150. This is generally considered a favorable setup. Common Mistakes Made by Indian Investors What’s a Good Risk-Reward Ratio? Most experienced Indian traders aim for a minimum of 1:2 or 1:3 in their trades. A 1:2 ratio means you stand to gain ₹2 for every ₹1 you risk. The higher the ratio, the more cushion you have for losses. Tips to Use Risk Reward Ratio Effectively Final Thoughts The risk-reward ratio is a foundational principle of successful trading. It helps you think in terms of probabilities and manage risk like a pro. Whether you’re investing in Nifty 50 stocks, mid-caps, or even F&O, understanding and applying RRR can significantly improve your long-term success.