
Double Bottom Pattern: A Complete Beginner’s Guide to Identifying Bullish Reversals
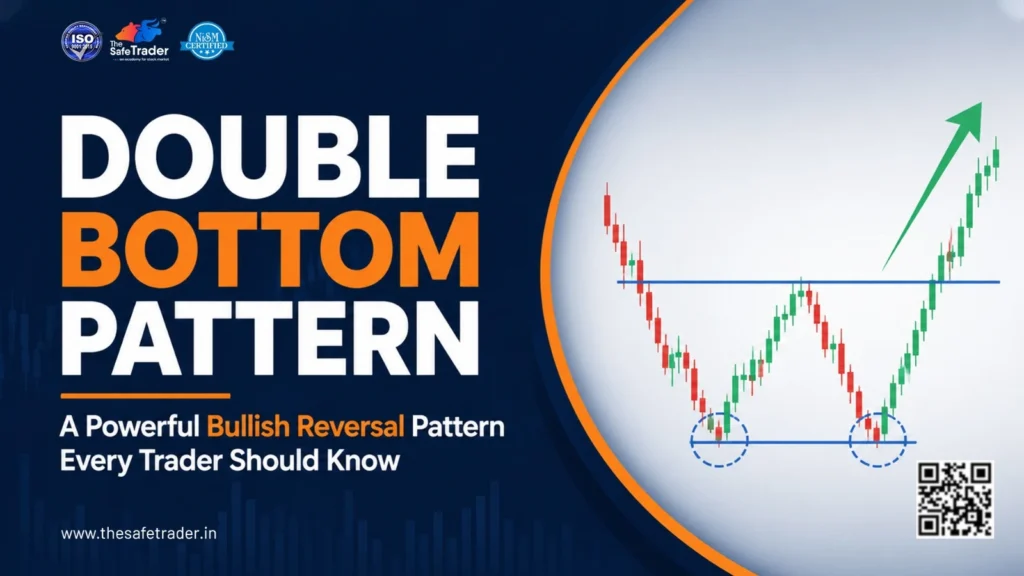
Have you seen stocks fall, then rally back, fall almost at the same level, then suddenly surge up? If yes, then that was probably a reliable bullish reversal chart pattern referred to as the Double Bottom Pattern. The Double Bottom Pattern enables traders to know when the downtrend is running out of steam and when the buyers are regaining control. Be an intraday trader, swing trader, or even an investor; the Double Bottom pattern knowledge will enable you to make sound trading decisions. What is a Double Bottom Pattern? The Double Bottom Pattern is a type of a bullish reversal chart pattern that develops after a sustained downtrend. The Double Bottom Pattern takes the form of the letter “W” and comprises two similar lows with a short period of recovery in between. This happens when the price breaks out of the neckline resistance level, and implies that buying pressure is rising and that there is potential for an uptrend to form. Components of a Double Bottom Pattern 1. First Bottom The stock hits the support level, where sellers start slowing down and allowing the buyers to enter and make a partial recovery. 2. Pullback Following the initial reversal, the price rallies but encounters resistance and then drops again. 3. Second Bottom The sellers try to drive the trend lower, but the stock fails to hit a lower low level. That means there is no more momentum on the part of the sellers. 4. Neckline Breakout This reversal pattern is completed when the stock closes above the resistance level that forms between the two bottom levels. The breakout should be accompanied by strong volume. Why Does a Double Bottom Pattern Form? The formation of a double bottom pattern occurs due to the changing dynamics of buyers and sellers in the market. In the first move lower, sellers are in control of the market and force the price down. After that, buyers come into play near the support level and form a temporary rally. When sellers attempt to form a second decline, they do not manage to create a new low, which indicates that buying pressure is getting stronger. After the price crosses the neckline, there will be more buyers coming into the market, and some sellers will close their short positions. Psychology Behind the Double Bottom Pattern Understanding the psychological aspect of trading can help traders understand why this pattern forms. The failure to create a lower low is what gives the Double Bottom Pattern its strength. Trading Rules for Double Bottom Pattern While trading this reversal pattern, here are some important rules to follow: ✔ The security must be trending downwards prior to this pattern forming.✔ The two bottoms should ideally be formed at similar levels.✔ There might be a reduction in volume during the formation of the second bottom.✔ Entry can only be made once there is a breakout from the neckline.✔ Higher volumes on breakout increases reliability of the pattern. Double Bottom Pattern Entry Strategy The ideal entry point for this pattern is once the security closes above the neckline resistance. The more aggressive trader may choose to trade the breakout immediately whereas the conservative trader will opt to enter on a retest of the neckline. Never trade the breakout prior to confirmation of the pattern because the pattern might fail and cause a false breakout. Stop Loss Placement A common stop loss strategy is to place the stop loss: This helps protect capital if the breakout fails. Double Bottom Pattern Profit Target How To Calculate Possible Target Price? But traders need to use good risk management along with target calculation. Common Mistakes Traders Make Many beginners make mistakes while trading the Double Bottom Pattern, including: Patience and discipline are essential when trading chart patterns. Double Bottom Pattern Example For instance, let us consider a stock moving from ₹1,200 to ₹1,000, but rising afterwards to ₹1,080 and falling back to ₹1,005. The moment the price moves higher than ₹1,080 with strong volume is the moment when the formation becomes confirmed. Traders can enter at the breakout level, set stop loss lower than ₹1,000, and target level on the basis of the height of the pattern. Conclusion Double Bottom is one of the most widely used bullish reversal pattern in trading to predict change in trend from a downtrend. With neckline confirmation, volume analysis, good placement of stop loss, etc., the trader can refine the decision-making process. At The Safe Trader Academy, we help traders develop practical skills in technical analysis, chart patterns, price action trading, and risk management. Through structured learning programs, live trading sessions, and market-focused education, traders can build a stronger understanding of setups like the Double Bottom Pattern and become more confident in their trading journey. Learning chart patterns is only one part of successful trading. Combining technical knowledge with discipline, psychology, and proper risk management is the foundation of consistent market participation. 📞 WhatsApp / Call: +91 92975 06666🌐 Website: https://thesafetraderacademy.com/