What Is Support & Resistance? How It Helps Traders & Investors Achieve Better Results
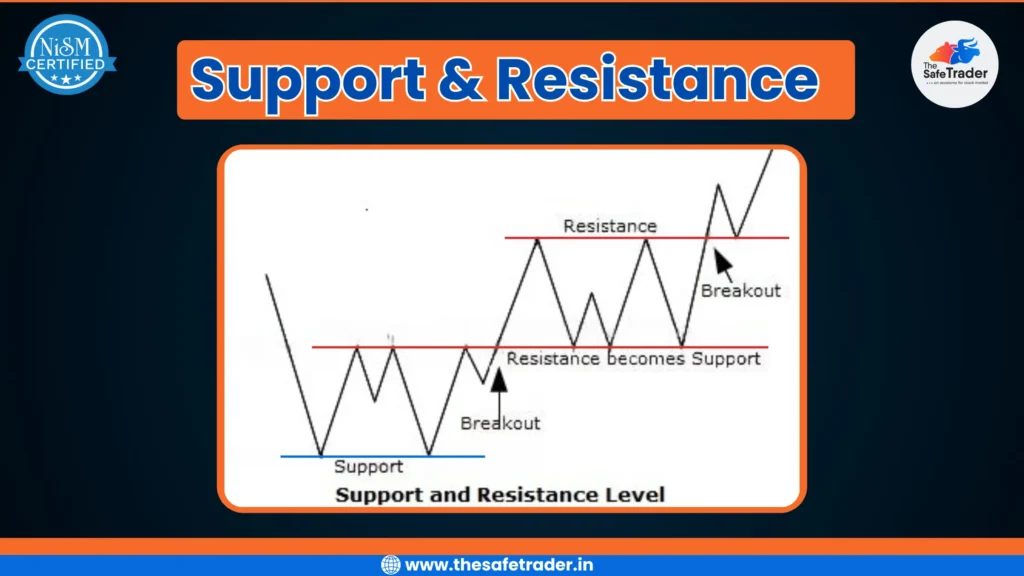
Understanding Support and Resistance is one of the foundational concepts in any Trading Strategy. Support-resistance identification is among the primary tools used by traders and investors to identify high-probability opportunities. When you know how to identify these levels, you can make better decisions while managing your risks. Being able to work with support and resistance will definitely improve your trading results. Understanding Support & Resistance: The Basics Every Trader Must Know What Are Support & Resistance? Support is a price level where buyers tend to jump in, preventing the price from dropping further. Think of support as a floor that keeps prices from falling below. Resistance is the opposite; it’s a price level where sellers emerge, stopping prices from climbing higher. It acts like a ceiling that holds prices back. Naturally, these levels come into existence by the actions of a lot of people, applying their interpretations of what they see in the market. Supply-demand situations and psychology are two driving forces behind it. When an enormous number of traders believe that a certain level will hold, it does create a self-fulfilling prophecy. The Significance of Support and Resistance in Trading Support and resistance levels act as mental barriers for traders. They shape how traders view possible market turns. Most successful traders keep an eye on these levels to catch reversals or breakouts before they happen. Statistically, about 80% of market reversals happen near these key levels. Experts agree that support and resistance are vital for planning trades. How Support & Resistance Levels Are Identified Chart Based Techniques The easiest way of finding support and resistance is by going through price charts and analyzing them. Look for regions where the price touches the level multiple times but fails to break through them. These levels are usually marked by horizontal lines, trendlines, or round numbers. With time, it makes zones that traders closely monitor. Technical Indicators and Tools To further confirm support/resistance levels, various tools could be used, including moving averages, Fibonacci retracements, and pivot points. Moving averages give the average prices for a given time and usually act as dynamic possible support or resistance. Fibonacci Levels give some ratios considered important and tell where the price may bounce. Pivot Points are calculated using prices of earlier days and give possible turning points. Confirming Support & Resistance Don’t just rely on a visual analysis. Wait for confirmation of support and resistance in the form of specific candlestick patterns like hammer or engulfing candles, a volume spike, or an unexpected price gap. Such hints will help you identify false breakouts when price only dips or jumps temporarily. Practical Applications of Support & Resistance for Traders and Investors Entry and Exit Strategies Support and resistance help determine when may be good times to buy or sell. A bounce off support may provide a great buy point. When the price is hitting resistance, it may be a good time to sell. A breakout happens when the price pushes beyond a level, with traders watching these events to rake in quick profits. Stop-Loss and Take-Profit Orders Smart traders will place stop-loss orders just below support or above resistance, limiting their losses. E.g., suppose you bought at support; then, setting a stop-loss just below that level ensures you don’t get wiped out from a sharp fall. Targets for profit should be near the next support or resistance, allowing you to get away with your gain easily. Managing Risk and Improving Trade Probability Support and resistance levels assist you in weighing risk versus reward. A trade that is stopped close to support and giving higher chances of gain near resistance has higher chances of winning. Think of these levels as nets to help you catch smarter trades. How It Helps Investors While traders focus on short-term movements, investors use support and resistance to: Limitations and Common Challenges False Breakouts and Whipsaws The price, at times, appears to break the support or resistance and then suddenly reverses. Such false signals bait traders into wrong trades. To avoid such mistakes, one must wait for confirmation such as volume spike or candle patterns. Dynamic Nature of Support & Resistance The levels are not set in stone; they evolve with the market. A support zone may become resistance in a week’s time. Therefore, stay alert and refresh your levels on an hourly basis. Combining Support & Resistance with Other Indicators Other indicators like oscillators or trend indicators help to increase accuracy. For example, volume analysis aids in confirming a legitimate breakout. By combining multiple signals, one can get a clearer picture and save themselves from bad trades. Advanced Concepts and Tips for Effective Use Trading Strategies Focused on Support & Resistance There are various methods for trading around support and resistance. Breakout trading intends to exploit strong price actions beyond these levels. Bounce trades are conducted by buying at support levels or selling at resistance levels. Range trades are executed between support and resistance to buy low and sell high within the channel. Using Multiple Timeframes Looking for support and resistance at different time frames just strengthens your analysis. Support on a daily chart might be more reliable than support on a 5-minute chart. Hence, long-term levels do hold more weight, with short-term levels signaling quick trade. How It Helps in Strategy Building ✅ For Traders: ✅ For Investors: Conclusion Support and Resistance are two fundamental pillars in Technical Analysis. They help you identify high-probability trade setups and manage risk. Spotting these levels accurately allows you to plan better entries, exits, and stop-loss placements. Remember, support and resistance are not perfect—they shift and evolve over time. Continuous learning, disciplined trading, and combining them with other tools make these levels powerful for consistent success. Keep practicing, stay alert, and let support and resistance guide your way to smarter trading.
Time Frame Guide for Traders: Find Your Perfect Fit in the Market
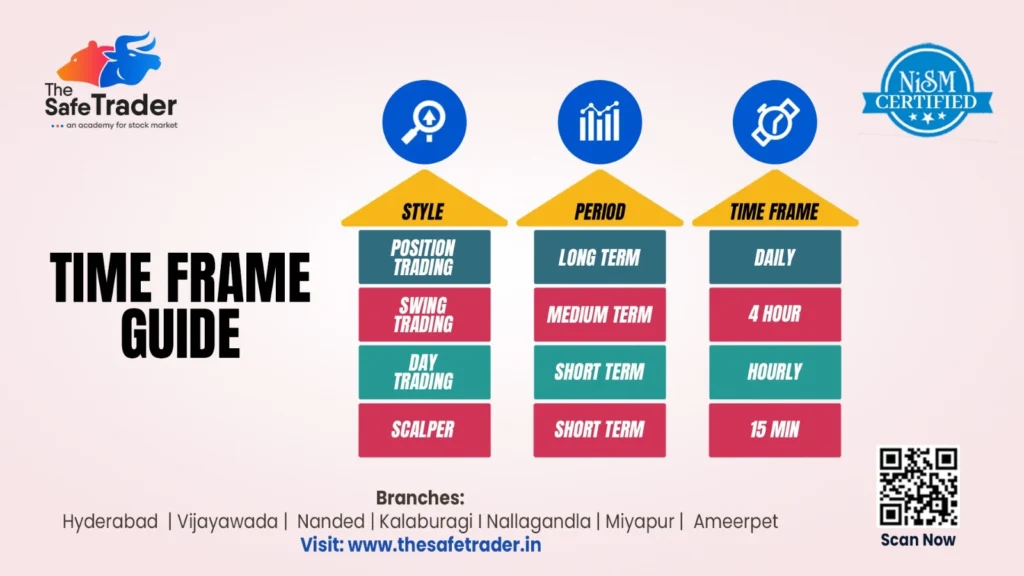
In the world of Stock Market Trading, the varieties of time frames and charting intervals are of utmost importance; they basically serve as the cornerstones of your trading strategy. From those that engage in long-term investing to those who engage in scalping by minutes, all of these traders should be fully aware of how time frames sync up with their goals, psychology, and available time. In this blog, we analyze the Time Frame Guide by The Safe Trader, a NISM-certified mentor that empowers traders in India. Let’s now proceed to understanding the details of various trading styles and how to relate them to your suitable time horizon. What is a Time Frame in Trading? A Time Frame is the length of time in which a price chart undergoes analysis in technical or trading decisions. In other words, whether you are observing the price movement shown by a candlestick every 15 minutes or the price movement on a daily or weekly chart, your time frame encompasses: Each style of trading coincides with a particular time frame and outlook- ranging from long-term investing to ultra-short-term scalping. Time Frame Guide for Traders: Styles, Periods & Time Frames 1. Position Trading (Long-Term) Pros: Cons: 2. Swing Trading (Medium-Term) Pros: Cons: 3. Day Trading (Short-Term) Pros: Cons: 4. Scalping (Ultra Short-Term) Benefits: Drawbacks: Learn From the Best – The Safe Trader Academy Their courses cover: The modules aim to prepare students for a safer trade experience, whether they be college students, working professionals, or budding traders. Bonus Strategy: Multi-Time Frame Analysis (MTFA) Professional traders often combine multiple time frames to improve their accuracy and timing. How it works: Example: A swing trader checks: MTFA = Bigger picture + Better timing. Psychology & Time Frames: Trading Time Frame Analysis Each trading style demands a different mindset: Style Requires Suits Position Trading Patience, trust in fundamentals Long-term thinkers Swing Trading Tactical execution, patience Part-time traders Day Trading Focus, speed, strategy Full-time professionals Scalping Ultra-discipline, low latency Advanced traders Note: Don’t copy others blindly. Know your emotional strength, risk tolerance, and time commitment before choosing a Trade. Common Mistakes to Avoid Tools & Indicators Used by Best Time Frame in Stock Market Different time frames demand different tools and techniques. Here’s a breakdown of what traders commonly use at each level: Time Frame Common Indicators Tools Daily Moving Averages, RSI, MACD, Trendlines Fundamental reports, Daily charts 4 Hour Bollinger Bands, Fibonacci Retracements, RSI TradingView, Price Action, Swing Setups Hourly VWAP, Support/Resistance, Breakout Zones Intraday charts, Sector strength analysis 15 Min EMA (9/21), Volume, Momentum Oscillators Fast-execution brokers, Level 2 data, Scalping bots The Safe Trader Advantages: What sets The Safe Trader apart? ✅ NISM-Certified Trainers ✅ Live Trading Sessions ✅ Customized Courses by Style ✅ Practical Learning + Psychological Coaching ✅ Supportive Community of Like-Minded Traders Whether you’re starting out or aiming to go pro, their step-by-step training on Time Frame Strategies ensures you’re always trading with purpose. Time Frame for Technical Analysis: Match Your Time Frame to Your Goals Your Profile Best Time Frame Working Professional Daily / 4 Hour (Swing/Position) College Student Hourly / Daily (Day/Swing) Full-Time Trader 15 Min / Hourly (Day/Scalping) Investor Daily / Weekly (Position) Choose one time frame, build mastery, then explore others. Final Thoughts: Time Frame in Stock Market The difference between a struggling trader and a consistent one often comes down to clarity of time frame. It’s your lens, your battlefield, your compass. 🔑 Understand it.🔒 Stick to it.📈 Master it. If you’re serious about building a strategy-based trading journey, The Safe Trader Academy has your back — in the classroom, in the markets, and in your mindset. Disclaimer:The information provided here is purely for educational and informational purposes only and reflects our personal analysis and opinions. We are not SEBI-registered advisors. Please consult a qualified financial advisor before making any investment decisions.