Happiest Minds Breakout: The Calm Before a Big Rally?
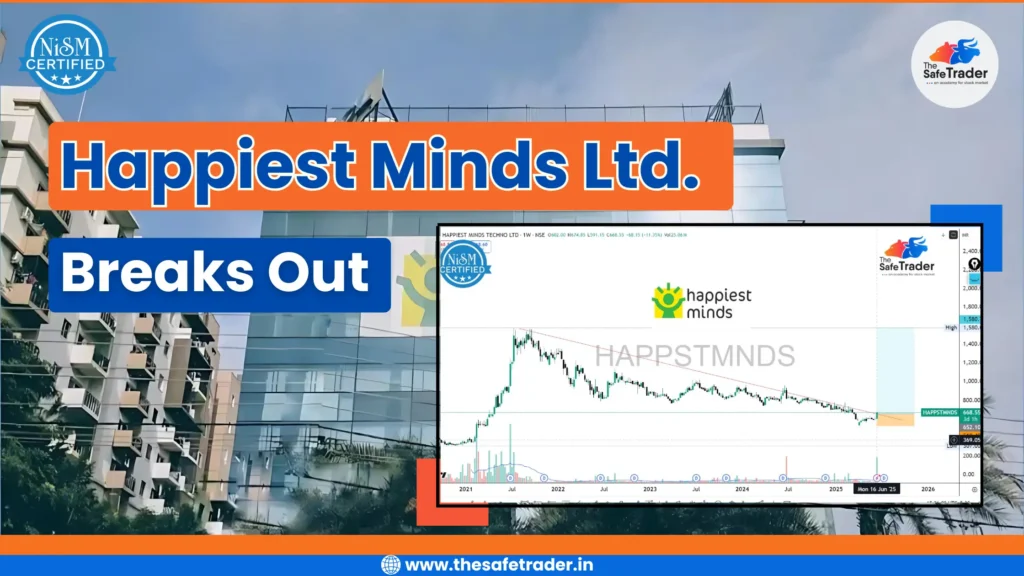
Introduction: Happiest Minds Technologies Ltd. (NSE: HAPPSTMNDS), a well-known mid-cap IT player, has been under the radar for the past couple of years due to its steep correction from all-time highs. But this week, a sudden 11.35% surge has turned all eyes back to this counter. Is this a technical breakout, or just another short-lived bounce? Let’s decode the price structure, volume action, and future prospects of this trending stock. A Silent Comeback in the Making? In a frequently hype-driven and herd-oriented market, opportunities do present themselves in stealth — including the Happiest Minds Technologies Ltd. (NSE: HAPPSTMNDS) share. After being battered by a prolonged downtrend lasting over three years, the stock has finally shown signs of life. The latest weekly candle tells a story of resurgence — a breakout backed by strong volume and a double-digit price move. Could this be the turning point? Let’s dive deeper. Historical Overview: Since Happiest Minds had gone public and made its debut on the primary stock market in 2020, it drew the investor’s eyes primarily for its digital-first IT service offering. Exploiting the tech boom, the price of this stock grew very quickly to around ₹1,580 by mid-2021. From hereon began a bearish trend for years, precipitated by: From its peaks at ₹1,580, the stock saw a plunge of over 75% to hit a lifetime low of ₹369 by early 2025 — really getting even the long-term investor-testing patience and conviction. The Fall from Grace: A Quick Recap For a time, Happiest Minds was a darling of the tech investors after the IPO boom. The new-age technology company was riding the wave of digital transformation to euphoric highs of ₹1,580 in 2021. But, as macro pressures, valuation concerns, and cheapest sector rotation started setting in, the stock fizzled out — losing over 75% of its value, hitting near its bottom at ₹369. This long and agonizing correction saw: Technical Chart Analysis The weekly chart is telling a totally different story — a reversal could be in play. Key Observations: Clean breakout above the long-term descending trendline, which is in existence since sometime mid-2021. This is the first weekly close above this trendline for nearly 3 years. Volume at the week stands at 25 million, much above the average, signifying strong institutional activity. The bounce happened from a major demand zone (₹600–₹650), showing interest of buyers at historical supports. RSI probably indicates a bullish turn-up with a move above 50, while MACD may soon look for a crossover if the momentum sustains. 📌 Breakout Zone: ₹660–₹675📌 Target Zone (Short-Term): ₹800–₹850📌 Major Resistance: ₹950 & ₹1,150📌 Stop-Loss for Traders: ₹620 (below trendline & base) Fundamental Perspective: Is the Business Still Strong? Despite the price erosion, Happiest Minds continues to be a profitable, cash-generating mid-cap IT player focused on digital services, AI, cloud, and product engineering. Fundamental Snapshot (FY24–25) While technicals are in focus, let’s not ignore the fundamentals: Metric Value Market Cap ₹9,700 Crores approx. PE Ratio 42x (post-correction) Revenue Growth (YoY) ~17% Net Profit Margin 20–21% Range Debt-Free Status ✅ Yes Despite the correction in price, the company remains fundamentally sound, with consistent growth in revenue and margins. It remains debt-free — a big positive in a rising interest rate environment. Market Sentiment: What Are Traders & Institutions Seeing? Positive Signals: Caution Flags: Verdict: A watch on the next 2 or 3 candles on a weekly chart might confirm whether momentum is sustainable. Outlook: Can Happiest Minds Reach ₹1,000+ Again? If technically the ₹800–₹850 barriers are swept away with conviction, the stock might go on to: Fundamentally, a revival of demand for digital transformation and AI-driven services could become the next catalyst. Bottom Line: If this indeed turns out to be a breakout with strong conviction, then Happiest Minds could be a journey towards four digits — but just onto market patience and proper risk management. Conclusion Happiest Minds Technologies seems to be at a conclusive turning point. The breakout witnessed recently, in conjunction with sound price action and volume, is an event that can never be ignored on the four-year-long downtrend. For the traders, it is the classic textbook breakout; for the investors, this could signal the beginning of a value-led recovery in the downtrodden but fundamentally promising IT stock. Zones of resistance like ₹750 and ₹850 will check the strength of this breakout, but under the current technical setup, momentum appears to be shifting. If there is a revival in the broader IT sector and a positive earnings performance, Happiest Minds may well get back to follow its bullish path. Always remember, success is built on discipline — enter smartly, manage risk, and protect your profits. Be it momentum trading or just believing long term in India’s digital growth story, Happiest Minds must feature on your portfolio radar for keen observation. Disclaimer:The information provided here is purely for educational and informational purposes only and reflects our personal analysis and opinions. We are not SEBI-registered advisors. Please consult a qualified financial advisor before making any investment decisions.
Kalyani Steels Breaks Out: Start of a New Bullish Trend?
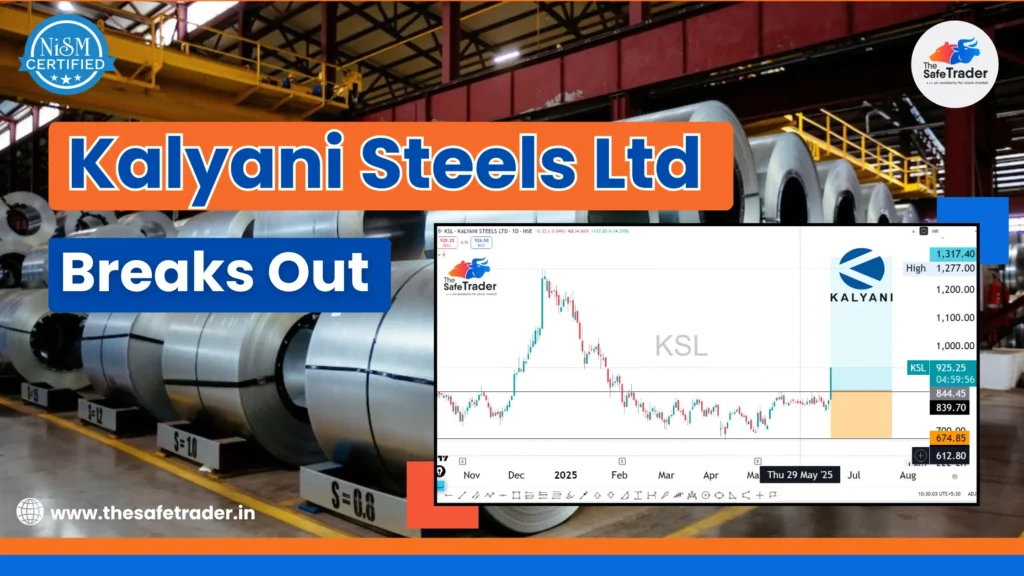
Introduction In a market where large-cap momentum has been grabbing headlines, mid-cap and small-cap stocks are quietly preparing for their next big move. One such stock making noise with its recent breakout is Kalyani Steels Ltd (KSL). After slipping sideways for months, Kalyani Steel Ltd has given bulls a reason to celebrate. On the 29th of May, 2025, the stock consumed a breakout above a very strong resistance level on huge volumes and bullish sentiment; this breakout shot the stock above 14.5% in a day and is now poised to mark the trend reversal, if not an all-out rally, in the coming months. But will the breakout remain sustained? Which price levels are of importance for the traders and investors to watch now? Let’s get into the technicals and payoff profiles along with alternate trade setups in KSL. Technical Picture – Breakout Confirmed The chart clearly shows that KSL has been consolidating between the ₹675 to ₹840 zone for over 4 months. This kind of long consolidation often precedes a strong directional move, and KSL has delivered just that. Key Technical Highlights: This is a classic breakout trade setup that fits well within a risk-managed strategy. Psychological Edge – Why This Matters Such breakouts after long-drawn consolidations typically denote a change in institutional behavior. The smart money tends to accumulate within sideways ranges, and momentum traders, retail participants, and algorithmic systems join the fray once a breakout occurs, hastening the price rally. The breakout seems more enticing, given its neat chart structure with a historical high zone at around ₹1,300, which is the new target. KSL: A Quick Fundamental Snapshot Kalyani Steels is a key player in the Indian alloy and special steel sector, supplying to automotive, engineering, and defense industries. India is currently emphasizing creating infrastructure, defense manufacturing, and ‘Make in India’–which means steel will see long-term demand. Recent triggers: These factors complement the bullish technical setup. Risk-Reward & Trade Planning Let’s lay out a potential trading plan for both swing and positional traders: Trade Element Value Entry Zone ₹920 – ₹940 Target 1 ₹1,277 Target 2 ₹1,317 Stop-Loss ₹674.85 Risk-Reward Ratio ~1:2.5 to 1:3 Note: Always manage position sizing based on risk tolerance. Do not chase after a gap-up; wait for pullbacks or consolidation near breakout zones. Trading Plan: How to Approach This Setup Let’s lay out a potential trading plan for both swing and positional traders: Strategy Type Entry Zone Target Zone Stop-Loss Swing Trading ₹915 – ₹935 ₹1,277 – ₹1,317 ₹675 Long-Term Investing On dips Above ₹1,300+ Below ₹650 Tips for Traders: ⚠️ Note: Always manage position sizing based on risk tolerance. Do not chase after a gap-up; wait for pullbacks or consolidation near breakout zones. Broader Market Context The breakout in Kalyani Steels occurs at a time when the metals sector is undergoing renewed strength with rising global demand and infrastructure push in India. If the Nifty Metal index continues to hold good, KSL can prove to be one of the best performers in the pack. Rising steel prices at the international level and government capex spending can help to sunset fundamentals. Why This Breakout Could Be Huge Final Views: A Trend in the Making? The breakout in Kalyani Steels Ltd is not just a technical event—it might be the beginning of a structural uptrend. While short-term volatility may persist, the broader trend looks upward. Traders and investors should keep this stock on their radar and watch for sustained momentum in the days to come. Disclaimer:The information provided here is purely for educational and informational purposes only and reflects our personal analysis and opinions. We are not SEBI-registered advisors. Please consult a qualified financial advisor before making any investment decisions.