What Are Offer-for-Sale, Rights Issue & Bonus Shares?

Stock Markets are not just about the buying and selling of shares. Both the company and corporate actions can have an adverse impact on stock price, ownership structure, and investor value. Three common terms one comes across are: Offer-for-Sale (OFS), Rights Issue, and Bonus Shares. These mechanisms operate toward very different ends-from raising money, rewarding shareholders, or meeting regulatory compliance. Let’s delve deep into the significance of these terms, how they work, and what an investor should beware of. Offer-for-Sale – An Easy Mode of Disinvestment An Offer-for-Sale permits the promoters of a listed company to sell a portion of their shareholding to the public by way of a stock exchange platform. No fresh issue of shares is involved, unlike an IPO (Initial Public Offering). It’s rather a transfer of ownership from existing holders to a set of new investors. Real-World Example: In 2023, the Government of India divested its stake in Hindustan Aeronautics Ltd (HAL) through OFS. The issue was kept open for one single day, with shares being offered at a slight discount, and the response was overwhelming from both retail and institutional investors. How Does an Offer For Sale Work? Now that you know what OFS is, let’s understand how OFS works. An Offer for Sale (OFS) is a process where a company or its major shareholders sell their shares to the public. Here’s how it works: 1. Announcement: The seller announces the OFS and sets a minimum price (floor price) for the shares on the stock exchange. 2. Bidding: Investors can place bids for the shares at or above this minimum price during the bidding period. 3. Allocation: The seller reviews the bids and decides how many shares each bidder gets based on their offers. 4. Settlement: Successful bidders have the shares credited to their accounts and the payment is deducted from their bank accounts. If bids are lower than the floor price, OFS fails and shares stay with the seller. OFS helps companies raise funds efficiently and meets regulatory requirements for public shareholding. How to Participate in OFS: Benefits & Risks: Pros Cons Opportunity to buy quality stocks at a discount Limited bidding time Transparent mechanism on exchange Allotment not guaranteed Encourages wider retail participation Price may fall after OFS due to oversupply Rights Issue – A Call to Existing Shareholders A Rights Issue permits a corporation to raise capital without incurring any loan or debt. This typically involves the offer to subscribe to additional shares at a discounted price-the discount having been calculated in a specified ratio between the points of time. Example: In 2020, Reliance Industries Limited (RIL) issued a rights issue for ₹53,125 crore-the highest ever in Indian history. Shares were offered in the ratio of 1:15 at ₹1,257 per share when market prices were at more than ₹1,400. What can shareholders do? Some Common Use Cases: Benefits & Risks: Pros Cons Discounted price to buy more shares May need to invest more capital Avoids debt, strengthens balance sheet Ignoring may dilute your shareholding Right renunciation allows liquidity Lower investor enthusiasm can depress stock Bonus Shares – A Reward for Loyalty Bonus Shares are issued when a company wants to share its profits with shareholders without paying out actual cash. It is like a gift – more shares for free, in proportion to your current holdings. Recent Example: In 2022, TCS declared a 1:1 bonus from 1:1; an extra share was given for every share held. This bonus stock issued increased liquidity and attracted retail interest. Accounting Behind Bonus: Bonus shares are issued from reserves or from surplus profits; hence no new capital is raised. While your shares increase in number, the price of the stock adjusts so that the total value of your investment remains the same initially. Common Ratios for Bonus Issues: Benefits & Risks: Pros Cons No cost involved Price gets adjusted, no real gain More shares can mean better liquidity No impact on company fundamentals Perceived positive signal from management Earnings per share (EPS) may reduce Summary Table: OFS vs Rights vs Bonus Feature Offer-for-Sale (OFS) Rights Issue Bonus Shares Purpose Promoters reduce stake Company raises capital Distribute surplus to shareholders Who gets it? Public investors Existing shareholders Existing shareholders Price At discount to market Discounted price Free Capital Raised? No Yes No Shareholder Dilution No (transfer only) Yes, if not subscribed No real dilution Timeline 1-2 days 15-30 days Declared + credited Investor Insights – What Should You Do? Corporate Action What Should You Do as an Investor? OFS Look at the valuation and discount offered. Use retail quota if available. Rights Issue Assess the reason for capital raising. Subscribe if the company has strong fundamentals. Bonus Shares Enjoy the benefit! Keep holding for long-term gains. It may improve liquidity and stock appeal. Conclusion Understanding corporate actions like OFS, Rights Issues, or Bonus Shares can allow you to spot opportunities and avoid surprises. If you are building a portfolio with a long-term horizon or are making short-term bets, awareness of these events is a clear edge. They are more than just administrative changes by companies; they are strategic signals. Always contemplate their impact on shareholding, capital structure, and stock price before taking action.
EV/EBITDA & EV/EBIT: Complete Guide to Stock Valuation

Most investors are aware of the usual valuation tools like Price/Earnings ratio that most investors use when trying to ascertain a company’s worth. But, analysts tend to go above that and use advanced, more insightful metrics such as EV/EBITDA and EV/EBIT. These two enterprise value ratios are especially handy for spotting undervalued stocks and comparing companies across industries and geographical locations. In this straightforward blog, we will explain EV/EBITDA and EV/EBIT in detail, how to track them, when to apply them, and why many times they are better than traditional ratios. What is Enterprise Value (EV)? Enterprise Value (EV) is a measure of a company’s total value, reflecting not just its market capitalization, but also its debt and cash positions. Formula: Enterprise Value (EV) = Market Capitalization + Total Debt – Cash & Cash Equivalents EV represents the theoretical takeover cost of a company-it’s what a buyer would pay to acquire the business, including its debt, minus its available cash. That’s why EV is considered a more accurate reflection of a firm’s value than just its market cap. What is EV/EBITDA? The full form of EV/EBITDA is Enterprise Value to Earnings Before Interest, Taxes, Depreciation, and Amortization. This ratio measures the value of a company relative to some measure of operating performance. Formula: EV/EBITDA = Enterprise Value / EBITDA Highlights: Ideal for: What is EV/EBIT? EV/EBIT, or Enterprise Value to Earnings Before Interest and Taxes, is another popular ratio used to value businesses. Unlike EBITDA, EBIT includes depreciation and amortization, with the latter being a more conservative view of the company’s profits. Formula: EV/EBIT = Enterprise Value / EBIT Key Features: Best For: EV/EBITDA vs. EV/EBIT: Key Differences Feature EV/EBITDA EV/EBIT Depreciation Included? ❌ Excluded ✅ Included Profitability View Optimistic Conservative Cash Flow Proxy Stronger for short-term Weaker for CapEx-heavy companies CapEx Consideration Ignores CapEx impact Reflects CapEx through depreciation Ideal For Asset-light industries Asset-heavy industries Real-World Example: Indian Stocks Company Enterprise Value EBITDA (₹ Cr) EBIT (₹ Cr) EV/EBITDA EV/EBIT Sector Infosys ₹6,50,000 Cr ₹39,000 ₹33,000 16.6x 19.7x IT Services Tata Motors ₹2,70,000 Cr ₹23,000 ₹16,500 11.7x 16.3x Auto & EV Power Grid ₹2,00,000 Cr ₹27,800 ₹21,100 7.2x 9.5x Power Utility L&T ₹3,00,000 Cr ₹27,000 ₹21,000 11.1x 14.3x Infrastructure These figures show that different sectors demand different valuation lenses. For instance, Power Grid’s low EV/EBITDA and EV/EBIT may indicate undervaluation, but require deeper context like regulatory environment, debt load, and future CapEx. P/E vs. EV/EBITDA & EV/EBIT Ratio Based On Ignores Debt? Ignores CapEx? Adjusted for Cash Flow? P/E Net Income ❌ No ✅ Yes ❌ No EV/EBITDA Operating Earnings ✅ Yes ✅ Yes ✅ Closer Proxy EV/EBIT Operating Earnings ✅ Yes ❌ No ✅ More Conservative ✅ EV-based metrics offer a truer picture of the company’s operational value because they include debt, exclude cash, and focus on earnings before interest and tax effects. When to Use EV/EBITDA vs. EV/EBIT Use EV/EBITDA When: Use EV/EBIT When: Practical Implications for Investors Common Mistakes to Avoid Conclusion: EV-Based Multiples for Smarter Investing Whether you are a beginner learning about stock valuation metrics, or a seasoned investor deep into fundamental analysis, the use of EV/EBITDA and EV/EBIT will give you a better perspective regarding a company’s financial health. These ratios transcend superficial profits, taking debt and cash flow potential and operating low efficiency into account. ✔ ️ Use EV/EBITDA with companies fast-growing and capital-light. ✔ ️ Use EV/EBIT for mature asset-heavy businesses where depreciation matters. Combine the two, and a more nuanced adjusted-for-risk understanding of the company’s true value will come to you-a capability every smart investor needs in today’s fast-moving market.
What is CAGR? How to Calculate It?

Investment returns are evaluated differently by numerous investors – some consider capital gains, and yet others consider annual returns. This is where the role of CAGR or Compound Annual Growth Rate becomes crucial. What is CAGR exactly, and how do you fathom it? Let us deconstruct what it implies. What is CAGR? It stands for Compound Annual Growth Rate. It is the rate at which investment grows on average annually, over a certain period, and with the assumption that profits were reinvested at the end of each year. In simple terms, it is the rate telling you how much your investment would have grown each year had it compounded steadily at that rate on an annual basis. Why is CAGR Important? Suppose your investment grew at different rates every year – CAGR simplifies that into one rate, uniform for every year. CAGR Formula The formula for CAGR is: Where: How to Calculate CAGR (Example) Let’s say you invested ₹1,00,000 in a mutual fund. After 5 years, it grew to ₹1,80,000. Things to Remember About CAGR Interpreting CAGR Results What does a high or low CAGR tell you? Evenly comparing the CAGR across various assets or time can help determine which has been the best investment. But, always remember that the CAGR assumes growth to be smooth and continuous, which in reality, it generally is not. There can be instances of sudden dips in the market, and these could camouflage the picture. Some professionals suggest that the CAGR is misleading if used alone. It does not measure fluctuations or risk. To get a full picture, use other metrics together with CAGR, for example, volatility or maximum drawdown. Practical tips for effective use of CAGR To get the most out of CAGR, follow all the below tips: As you become more familiar with CAGR, you’ll spot opportunities and risks faster. It’s a simple number, but its insights run deep. Final Thoughts CAGR is a simple yet powerful tool that helps you understand how your investments have performed over time – as if they had grown at a steady rate. Whether you’re comparing mutual funds, stocks, or even your business’s sales growth, knowing how to calculate and interpret CAGR can make you a smarter investor! 👉 Join The Safe Trader Academy today and start trading like a pro.
What Is ROCE And ROE? A Quick Financial Guide

When it comes to evaluating the performance of a company, investors and analysts rely on key financial ratios to measure how efficiently the company generates profits from its resources. Among these, ROCE and ROE are two crucial metrics that provide valuable insights into how well a business is utilizing its capital and shareholders’ funds. This blog explains various aspects of ROCE and ROE along with their methods of calculations, indicators, and the reasoning behind why an investor and a business owner need to be concerned about them. What is Return on Capital Employed (ROCE)? The capital employed is the sum total of debt and equity, and ROCE is a measurement of how good the business is in using its total capital to generate profits. It gives an idea of the amount of profit generated for every rupee (or dollar) of capital employed in the business. ROCE formula is: Where: What does ROCE indicate? What is Return on Equity (ROE)? Return on Equity measures the profitability of a firm in relation to shareholders’ equity. In simpler terms, it indicates the efficiency with which the company is using shareholders’ capital to generate net profit. Formula for ROE: Where: What does ROE indicate? ROCE vs ROE: What’s the Difference? Aspect ROCE ROE Measures Returns on total capital (debt + equity) Returns on shareholders’ funds Useful for Evaluating capital efficiency overall Evaluating shareholder returns Includes debt? ✅ Yes, it considers debt and equity ❌ No, only equity Best for Capital-intensive companies Asset-light or equity-heavy companies Example: Imagine two companies: Why Should Investors Track ROCE and ROE? Note: Sometimes, a sky-high ROE is because a company has taken too much debt and thereby lowered its equity. It might be a sort of artificial inflation of the ROE. That’s why ROCE and ROE must be looked at together. Key Takeaways Conclusion In fact, both ROCE and ROE are significant indicators of the financial scorecard of a company. ROCE looks at returns generated in respect of all sources of capital, whereas ROE analyzes shareholder wealth creation. From an investor perspective, analyzing both would yield a much better insight into how a company is faring with respect to its resource deployment and value creation. 👉 Join The Safe Trader Academy today and start trading like a pro.
Price-to-Earnings (P/E) Ratio: A Beginner’s Guide

If you are interested in Stock Investing, you have probably heard of the P/E Ratio. It is one of the most widely used tools for evaluating whether a stock’s price is fair enough. But what exactly is it? We will break it into simpler terms so that anyone -even a beginner can understand. What Does P/E Ratio Tell You? The Price-Earnings Ratio is an indicator that reflects how much the market is willing at present to pay for ₹1 worth of a company’s earnings. 👉 A higher P/E means investors expect higher growth and are willing to pay more for future earnings.👉 A lower P/E could mean the stock is undervalued – or that the company’s growth prospects aren’t great. In brief: ➡The P/E ratio depicts a measure of investor confidence and of future expectations about the profitability of a company. How to Calculate P/E Ratio? Where: Example Imagine Company A’s share price = ₹300EPS (last 12 months) = ₹15 ✅ This means investors are paying ₹20 for every ₹1 of the company’s earnings. How Do Investors Use the P/E Ratio? Example: Nifty IT Sector companies may have a slightly higher average P/E than Nifty PSU Bank companies because investors expect faster growth from IT companies. Types of P/E Ratios to Know Type What it Means Trailing P/E Based on past 12 months’ actual earnings. Forward P/E Based on forecasted earnings for the next year. ➡ Trailing P/E tells you what has happened. ➡ Forward P/E tells you what might happen. P/E Ratio: Points to Remember P/E Ratios in Various Scenarios Limitations of the P/E Ratio How to Effectively Use P/E? Real-Life Analog: The Indian Stock Market Interface Final Thoughts The P/E ratio is like a quick health check of a stock’s valuation. But remember: A high P/E doesn’t always mean expensive – it could mean growth.A low P/E doesn’t always mean cheap – it could mean trouble. 👉 Join The Safe Trader Academy today and start trading like a pro.
India’s IPO Rush: Top Listings in June 2025

An IPO (Initial Public Offering) is the process by which a private company offers its shares to the public for the first time and gets listed on a stock exchange. It allows companies to raise capital from investors while giving the public a chance to own a stake in the business. June 2025 has been a blockbuster month for India’s primary market. With a mix of large-cap and SME IPOs hitting the street, investor sentiment remains strong. From banking and real estate to engineering and healthcare, companies across sectors have chosen June as the best time to go public. Let’s take a closer look at the Top IPOs in June 2025, their details, and what investors should watch for. Highlights of June 2025 IPO Activity Latest IPOs in June 2025 1. HDB Financial Services IPO 2. Kalpataru Projects International 3. Sambhav Steel Tubes 4. Indogulf Cropsciences Top SME IPOs to Watch India’s SME IPO segment continues to outperform in 2025. Here are some strong performers this month: 1. Eppeltone Engineers Ltd 2. Safe Enterprises Retail Fixtures 3. Aakaar Medical Technologies 4. AJC Jewel Limited Other notable SME IPOs include: Upcoming IPOs – What’s Ahead? PhonePe IPO – Coming Soon SEBI Approvals Investor Insights – Key Takeaways Tips for Investors Final Thoughts June 2025 IPOs in India mark an exciting time for equity markets. Whether you’re an investor looking for stable long-term plays or short-term listing gains, there’s something for everyone. With marquee names like HDB Financial and a booming SME pipeline, IPO activity is expected to remain strong in the months ahead. Stay informed, invest wisely, and make the most of India’s IPO wave in 2025!
Types of Investors in the Indian Stock Market
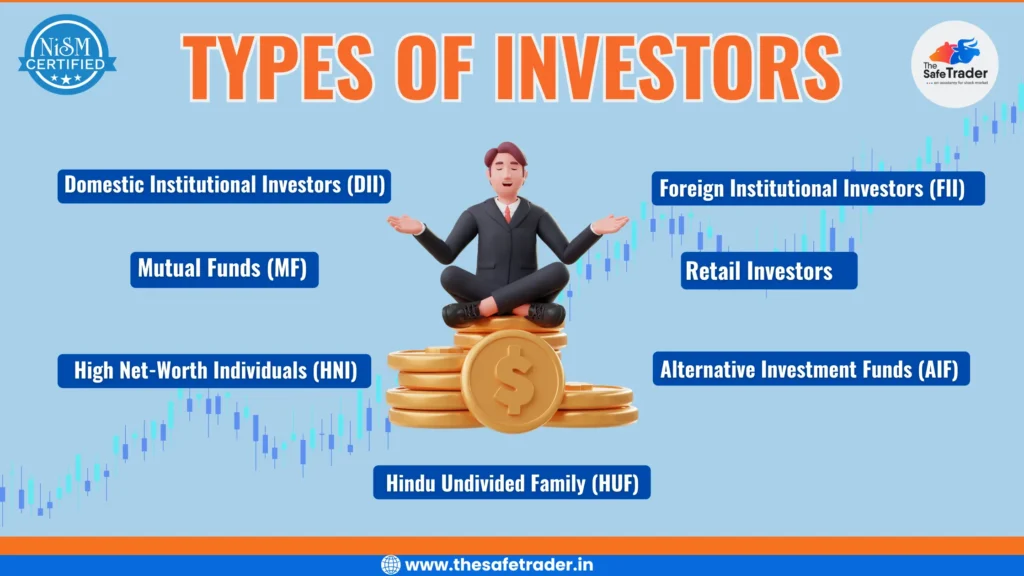
The Indian Stock Market is one of the largest and fastest-growing equity markets globally, driven by a mix of domestic and foreign investors. Each type of investor plays a distinct role in shaping market movements, liquidity, and sentiment. Let’s explore these types, their roles, and their impact – with real numbers and trends. Domestic Institutional Investors (DII) DIIs include mutual funds of India, insurance companies, pension funds, banks, and other big entities investing in domestic securities. Impact: In many cases, DIIs are the counterforce to FIIs. For example, when FIIs withdraw more than a lakh crore between 2022 and 2023 because of global uncertainty, DIIs gave support to the market with net inflows of nearly the same magnitude. Foreign Institutional Investors (FII) FIIs/FPIs are overseas funds investing in Indian equities, debt, and other securities. Impact: Generally, FIIs hold the status of suggestive influences of the market. Heavy inflows by them generate upward trends (take post-COVID), while their withdrawal creates volatility. High Net-Worth Individuals (HNI) HNIs are individuals with significant investable surplus, often above ₹2 crore, investing in stocks, bonds, PMS schemes, or AIFs. Impact: HNIs often take concentrated bets or participate in block deals. Their moves are closely watched by brokers and analysts. Retail Investors These are individual investors who invest small amounts compared to institutions and HNIs. They participate through direct stocks, mutual funds, or ETFs. Impact: Retail investors dominate trading volume in small-cap and mid-cap stocks and are quickly becoming a force within IPO subscription. Hindu Undivided Family (HUF) The Indian legal system allows the traditional family investment structure, treated as a separate entity for tax and investment purposes. HUFs have no separate public record for their holdings but form part of the retail/HNI investor set. They subconsciously get associated with long-term wealth-building opportunities like holding blue-chip stocks or mutual funds. Alternative Investment Funds (AIF) As the name indicates, they pool money from HNIs and institutional investors to invest in non-traditional assets such as private equity, venture capital, real estate, distressed debt, and hedge funds. Impact: AIFs take the Indian startup ecosystem, infrastructure, and other alternative sectors to more depth than what public markets offer. Mutual Funds (MF) Mutual funds pool savings from retail and HNI investors and invest in diversified portfolios of stocks, bonds, or hybrid assets. Impact: Mutual funds help channel domestic savings into the stock market and are key drivers of long-term stability and disciplined investing. Snapshot of Ownership (2024) Investor Type Market Share in NSE-Listed Cos (Approx.) FIIs / FPIs 18% – 20% DIIs 16% – 18% Mutual Funds Part of DIIs (AUM ₹52 lakh crore) Retail + HNI 7% – 8% Government ~6% (through direct holdings in PSUs) Conclusion The Indian stock market is a blend of domestic and global forces: As an investor, understanding these players helps you interpret market moves better and design smarter strategies!
What are Index Options? Lot Size & Expiry Days Explained
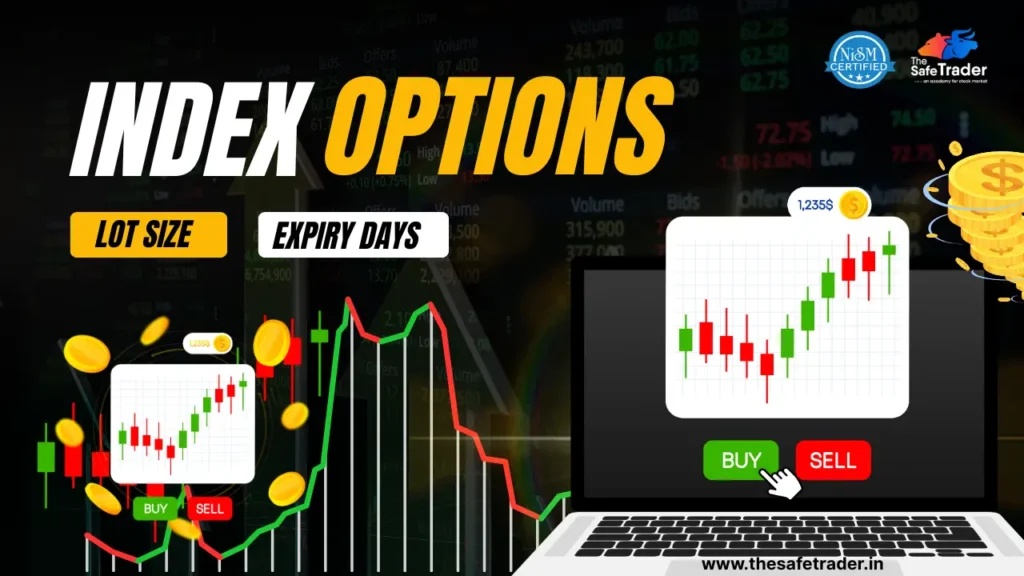
Index Options have grown exponentially in popularity in India. With instruments like NIFTY, BANKNIFTY, and FINNIFTY, retail and institutional traders now have powerful tools to speculate, hedge, or diversify their exposure. This blog unpacks everything you need to know about Index Options, their lot sizes, and expiry schedules. What Are Index Options? An Index Option is a derivative contract that draws value from the underlying index like the NIFTY 50, BANK NIFTY, among others. They are European-style options, which means the exercise can only be done at expiry, and since they are cash-settled, there is no actual exercise of shares. There are two types of index options: How Are Index Options Useful? Use Case Benefit Hedging Protect portfolio against downside in market crashes. Speculation Take directional bets on market trends with limited capital. Income Generation Use strategies like covered calls or iron condors. Portfolio Diversification Reduce dependence on individual stocks by trading entire market segments. For example, if you expect the banking sector to outperform in the short term, trading BANKNIFTY options can offer leveraged exposure without needing to buy multiple banking stocks. Current Index Options Lot Sizes (Jun–Aug 2025) Lot size refers to the minimum number of units you need to trade in an options contract. Index Symbol Lot Size (Jun 2025) Lot Size (Jul 2025) Lot Size (Aug 2025) NIFTY 50 NIFTY 75 75 75 BANK NIFTY BANKNIFTY 30 35 35 FINNIFTY FINNIFTY 65 65 65 MIDCPNIFTY MIDCPNIFTY 120 140 140 NIFTY NEXT 50 NIFTY NEXT 50 25 25 25 Note: Lot sizes can be revised quarterly by the NSE based on the price movement and liquidity of each index. Expiry Schedule – Weekly & Monthly Expiry refers to the date on which the option contract ceases to exist. Each index has weekly and monthly expiries, providing frequent opportunities to trade. Index Weekly Expiry Monthly Expiry NIFTY Thursday Last Thursday of the month BANKNIFTY Wednesday Last Wednesday of the month FINNIFTY Tuesday Last Tuesday of the month MIDCPNIFTY Monday Last Monday of the month NIFTYNEXT50 Friday Last Friday of the month SENSEX ❌ (only monthly) Last Thursday of the month BANKEX ❌ (only monthly) Last Thursday of the month 🛑 If the expiry day is a trading holiday, it will be preponed to the previous trading day. Why Are Lot Sizes Important? Key Features of Popular Index Options NIFTY 50 BANKNIFTY FINNIFTY MIDCAPNIFTY NIFTY NEXT 50 BSE Derivatives: SENSEX & BANKEX Index Weekly Expiry Monthly Expiry Lot Size SENSEX ❌ Last Thursday 15 BANKEX ❌ Last Thursday 20 BSE offers derivative contracts on SENSEX and BANKEX, but trading volumes are comparatively lower than NSE. These instruments are generally used by arbitrageurs or long-term hedgers. Strategy Example: Weekly Trading in Index Options If you’re a weekly trader, here’s how you can build a plan: Risk Factors to Consider Trading Tips Final Thoughts Index Options are powerful instruments in the hands of learned traders and investors. By understanding lot sizes, expiry days, and the characteristic features of each index, you will be in a position to frame a strategy that serves your financial goals. Whether you are: 👉 Index options can bring flexibility and depth to your trading portfolio.
What Is Support & Resistance? How It Helps Traders & Investors Achieve Better Results
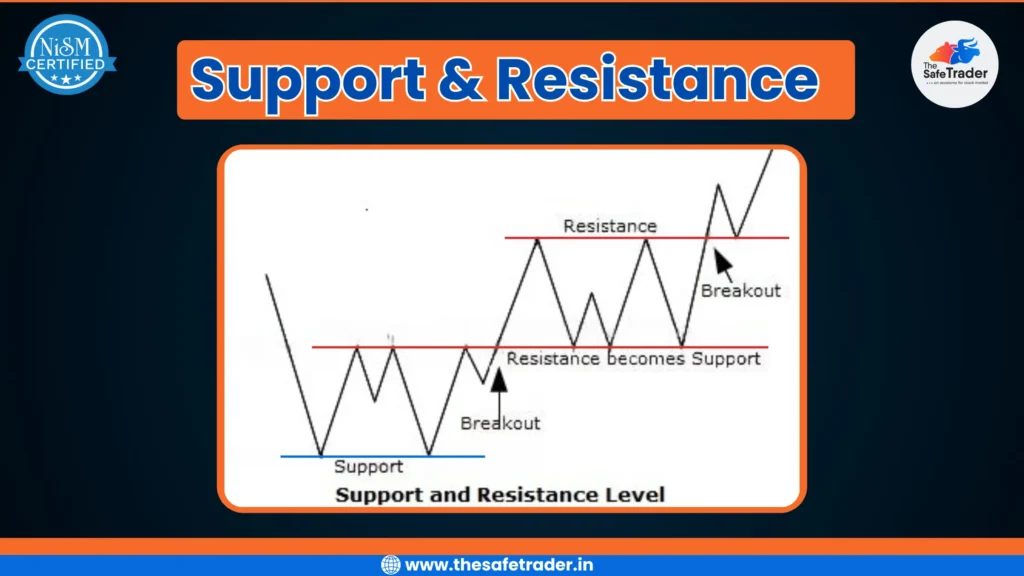
Understanding Support and Resistance is one of the foundational concepts in any Trading Strategy. Support-resistance identification is among the primary tools used by traders and investors to identify high-probability opportunities. When you know how to identify these levels, you can make better decisions while managing your risks. Being able to work with support and resistance will definitely improve your trading results. Understanding Support & Resistance: The Basics Every Trader Must Know What Are Support & Resistance? Support is a price level where buyers tend to jump in, preventing the price from dropping further. Think of support as a floor that keeps prices from falling below. Resistance is the opposite; it’s a price level where sellers emerge, stopping prices from climbing higher. It acts like a ceiling that holds prices back. Naturally, these levels come into existence by the actions of a lot of people, applying their interpretations of what they see in the market. Supply-demand situations and psychology are two driving forces behind it. When an enormous number of traders believe that a certain level will hold, it does create a self-fulfilling prophecy. The Significance of Support and Resistance in Trading Support and resistance levels act as mental barriers for traders. They shape how traders view possible market turns. Most successful traders keep an eye on these levels to catch reversals or breakouts before they happen. Statistically, about 80% of market reversals happen near these key levels. Experts agree that support and resistance are vital for planning trades. How Support & Resistance Levels Are Identified Chart Based Techniques The easiest way of finding support and resistance is by going through price charts and analyzing them. Look for regions where the price touches the level multiple times but fails to break through them. These levels are usually marked by horizontal lines, trendlines, or round numbers. With time, it makes zones that traders closely monitor. Technical Indicators and Tools To further confirm support/resistance levels, various tools could be used, including moving averages, Fibonacci retracements, and pivot points. Moving averages give the average prices for a given time and usually act as dynamic possible support or resistance. Fibonacci Levels give some ratios considered important and tell where the price may bounce. Pivot Points are calculated using prices of earlier days and give possible turning points. Confirming Support & Resistance Don’t just rely on a visual analysis. Wait for confirmation of support and resistance in the form of specific candlestick patterns like hammer or engulfing candles, a volume spike, or an unexpected price gap. Such hints will help you identify false breakouts when price only dips or jumps temporarily. Practical Applications of Support & Resistance for Traders and Investors Entry and Exit Strategies Support and resistance help determine when may be good times to buy or sell. A bounce off support may provide a great buy point. When the price is hitting resistance, it may be a good time to sell. A breakout happens when the price pushes beyond a level, with traders watching these events to rake in quick profits. Stop-Loss and Take-Profit Orders Smart traders will place stop-loss orders just below support or above resistance, limiting their losses. E.g., suppose you bought at support; then, setting a stop-loss just below that level ensures you don’t get wiped out from a sharp fall. Targets for profit should be near the next support or resistance, allowing you to get away with your gain easily. Managing Risk and Improving Trade Probability Support and resistance levels assist you in weighing risk versus reward. A trade that is stopped close to support and giving higher chances of gain near resistance has higher chances of winning. Think of these levels as nets to help you catch smarter trades. How It Helps Investors While traders focus on short-term movements, investors use support and resistance to: Limitations and Common Challenges False Breakouts and Whipsaws The price, at times, appears to break the support or resistance and then suddenly reverses. Such false signals bait traders into wrong trades. To avoid such mistakes, one must wait for confirmation such as volume spike or candle patterns. Dynamic Nature of Support & Resistance The levels are not set in stone; they evolve with the market. A support zone may become resistance in a week’s time. Therefore, stay alert and refresh your levels on an hourly basis. Combining Support & Resistance with Other Indicators Other indicators like oscillators or trend indicators help to increase accuracy. For example, volume analysis aids in confirming a legitimate breakout. By combining multiple signals, one can get a clearer picture and save themselves from bad trades. Advanced Concepts and Tips for Effective Use Trading Strategies Focused on Support & Resistance There are various methods for trading around support and resistance. Breakout trading intends to exploit strong price actions beyond these levels. Bounce trades are conducted by buying at support levels or selling at resistance levels. Range trades are executed between support and resistance to buy low and sell high within the channel. Using Multiple Timeframes Looking for support and resistance at different time frames just strengthens your analysis. Support on a daily chart might be more reliable than support on a 5-minute chart. Hence, long-term levels do hold more weight, with short-term levels signaling quick trade. How It Helps in Strategy Building ✅ For Traders: ✅ For Investors: Conclusion Support and Resistance are two fundamental pillars in Technical Analysis. They help you identify high-probability trade setups and manage risk. Spotting these levels accurately allows you to plan better entries, exits, and stop-loss placements. Remember, support and resistance are not perfect—they shift and evolve over time. Continuous learning, disciplined trading, and combining them with other tools make these levels powerful for consistent success. Keep practicing, stay alert, and let support and resistance guide your way to smarter trading.
Time Frame Guide for Traders: Find Your Perfect Fit in the Market

In the world of Stock Market Trading, the varieties of time frames and charting intervals are of utmost importance; they basically serve as the cornerstones of your trading strategy. From those that engage in long-term investing to those who engage in scalping by minutes, all of these traders should be fully aware of how time frames sync up with their goals, psychology, and available time. In this blog, we analyze the Time Frame Guide by The Safe Trader, a NISM-certified mentor that empowers traders in India. Let’s now proceed to understanding the details of various trading styles and how to relate them to your suitable time horizon. What is a Time Frame in Trading? A Time Frame is the length of time in which a price chart undergoes analysis in technical or trading decisions. In other words, whether you are observing the price movement shown by a candlestick every 15 minutes or the price movement on a daily or weekly chart, your time frame encompasses: Each style of trading coincides with a particular time frame and outlook- ranging from long-term investing to ultra-short-term scalping. Time Frame Guide for Traders: Styles, Periods & Time Frames 1. Position Trading (Long-Term) Pros: Cons: 2. Swing Trading (Medium-Term) Pros: Cons: 3. Day Trading (Short-Term) Pros: Cons: 4. Scalping (Ultra Short-Term) Benefits: Drawbacks: Learn From the Best – The Safe Trader Academy Their courses cover: The modules aim to prepare students for a safer trade experience, whether they be college students, working professionals, or budding traders. Bonus Strategy: Multi-Time Frame Analysis (MTFA) Professional traders often combine multiple time frames to improve their accuracy and timing. How it works: Example: A swing trader checks: MTFA = Bigger picture + Better timing. Psychology & Time Frames: Trading Time Frame Analysis Each trading style demands a different mindset: Style Requires Suits Position Trading Patience, trust in fundamentals Long-term thinkers Swing Trading Tactical execution, patience Part-time traders Day Trading Focus, speed, strategy Full-time professionals Scalping Ultra-discipline, low latency Advanced traders Note: Don’t copy others blindly. Know your emotional strength, risk tolerance, and time commitment before choosing a Trade. Common Mistakes to Avoid Tools & Indicators Used by Best Time Frame in Stock Market Different time frames demand different tools and techniques. Here’s a breakdown of what traders commonly use at each level: Time Frame Common Indicators Tools Daily Moving Averages, RSI, MACD, Trendlines Fundamental reports, Daily charts 4 Hour Bollinger Bands, Fibonacci Retracements, RSI TradingView, Price Action, Swing Setups Hourly VWAP, Support/Resistance, Breakout Zones Intraday charts, Sector strength analysis 15 Min EMA (9/21), Volume, Momentum Oscillators Fast-execution brokers, Level 2 data, Scalping bots The Safe Trader Advantages: What sets The Safe Trader apart? ✅ NISM-Certified Trainers ✅ Live Trading Sessions ✅ Customized Courses by Style ✅ Practical Learning + Psychological Coaching ✅ Supportive Community of Like-Minded Traders Whether you’re starting out or aiming to go pro, their step-by-step training on Time Frame Strategies ensures you’re always trading with purpose. Time Frame for Technical Analysis: Match Your Time Frame to Your Goals Your Profile Best Time Frame Working Professional Daily / 4 Hour (Swing/Position) College Student Hourly / Daily (Day/Swing) Full-Time Trader 15 Min / Hourly (Day/Scalping) Investor Daily / Weekly (Position) Choose one time frame, build mastery, then explore others. Final Thoughts: Time Frame in Stock Market The difference between a struggling trader and a consistent one often comes down to clarity of time frame. It’s your lens, your battlefield, your compass. 🔑 Understand it.🔒 Stick to it.📈 Master it. If you’re serious about building a strategy-based trading journey, The Safe Trader Academy has your back — in the classroom, in the markets, and in your mindset. Disclaimer:The information provided here is purely for educational and informational purposes only and reflects our personal analysis and opinions. We are not SEBI-registered advisors. Please consult a qualified financial advisor before making any investment decisions.