Types of Charts in TradingView: A Guide for Traders of All Levels
TradingView is a powerful platform for traders and investors, offering a wide range of chart types to analyze the markets. Choosing the right chart type is crucial as it affects how you interpret market movements and make trading decisions. In this article, we’ll explore the most popular chart types available on TradingView, their uses, and which chart might be best suited for entry-level traders and professionals. 1. Line Chart Overview: A Line Chart connects the closing prices of a stock or asset over a specific period, creating a simple line.Best for: Entry-Level Traders: Ideal for beginners as it provides a clean, clutter-free view of price trends. Analyzing long-term trends. Pros: Simple and easy to understand. Highlights the general direction of the market. Cons: Lacks detailed information like open, high, and low prices. 2. Bar Chart Overview: A Bar Chart displays price information using vertical bars for each time period, indicating the open, high, low, and close (OHLC) prices. Best for: Intermediate traders who want to understand market volatility. Visualizing price ranges and trends. Pros: Detailed representation of price movement. Useful for identifying trend reversals. Cons: May appear cluttered to beginners. 3. Candlestick Chart Overview: The Candlestick Chart is one of the most widely used chart types. It uses candles to show OHLC prices within a specific period, with the body of the candle representing the price range between the open and close. Best for: All Levels of Traders: Beginners to professionals can benefit from its clear representation of market sentiment. Analyzing market trends, patterns, and reversals. Pros: Easy to spot bullish and bearish trends. Rich visual representation of price action. Patterns like Doji, Hammer, and Engulfing provide actionable insights. Cons: Requires a learning curve to master candlestick patterns. 4. Heikin-Ashi Chart Overview: The Heikin-Ashi Chart smoothens price data to create a clearer view of trends, making it easier to identify trend direction without much noise. Best for: Professional traders looking for trend-following strategies. Swing and positional traders. Pros: Filters out market noise. Helps in identifying trends and reversals clearly. Cons: Does not show exact prices (open, high, low, close). 5. Renko Chart Overview: Renko Charts focus on price movement rather than time, with “bricks” appearing when the price moves a certain amount. Best for: Professional traders focused on reducing noise and tracking trends. Identifying support and resistance levels. Pros: Eliminates market noise. Clear trend signals. Cons: Ignores time, which might be important for certain trading strategies. 6. Point & Figure Chart Overview: Point & Figure Charts focus solely on price movement and ignore time and volume. They use “X” and “O” to represent upward and downward movements. Best for: Traders analyzing long-term price trends and breakout points. Pros: Excellent for identifying breakout levels. Reduces market noise. Cons: Not ideal for short-term trading. 7. Area Chart Overview: Similar to the Line Chart but with a shaded area beneath the line to emphasize the trend. Best for: Entry-level traders who prefer a visual representation of trends. Long-term investors. Pros: Simple and visually appealing. Highlights trends over time. Cons: Lacks detailed information. Which Chart Type is Most Useful? For Entry-Level Traders: Line Charts or Area Charts are the simplest to start with as they emphasize trends without overwhelming detail. Once comfortable, beginners can transition to Candlestick Charts for more in-depth analysis. For Professional Traders: Heikin-Ashi, Renko, and Point & Figure Charts are preferred for their ability to filter noise and highlight clear trends. Professional traders also use Candlestick Charts extensively for precision trading. For Intraday Traders: Candlestick Charts and Heikin-Ashi Charts are popular for intraday trading as they help identify short-term price movements and trends. For Swing/Positional Traders: Renko and Heikin-Ashi Charts are effective in identifying longer-term trends and reducing market noise. Which Chart Type is Most Accurate? Accuracy depends on your trading strategy. Candlestick Charts are considered reliable for most trading styles due to their detailed price representation. However, Renko and Heikin-Ashi Charts are more accurate for trend-following strategies as they filter out noise. Which Chart Type Can You Trust? All chart types are trustworthy if you use them correctly. The choice depends on your trading goals: Use Candlestick Charts for detailed analysis and pattern recognition. Use Heikin-Ashi Charts or Renko Charts for smooth trend visualization. Beginners should start with Line Charts to build confidence. Conclusion TradingView offers a variety of chart types to cater to different trading styles and skill levels. Beginners can start with Line or Candlestick Charts, while professionals can explore advanced options like Heikin-Ashi and Renko Charts. Remember, no chart is inherently better than another—it’s about aligning the chart type with your trading strategy and goals. Happy trading!
Discontinuation of Weekly Derivatives Contracts on Bank Nifty, Midcap Nifty, and FinNifty: A New Chapter in Indian Markets
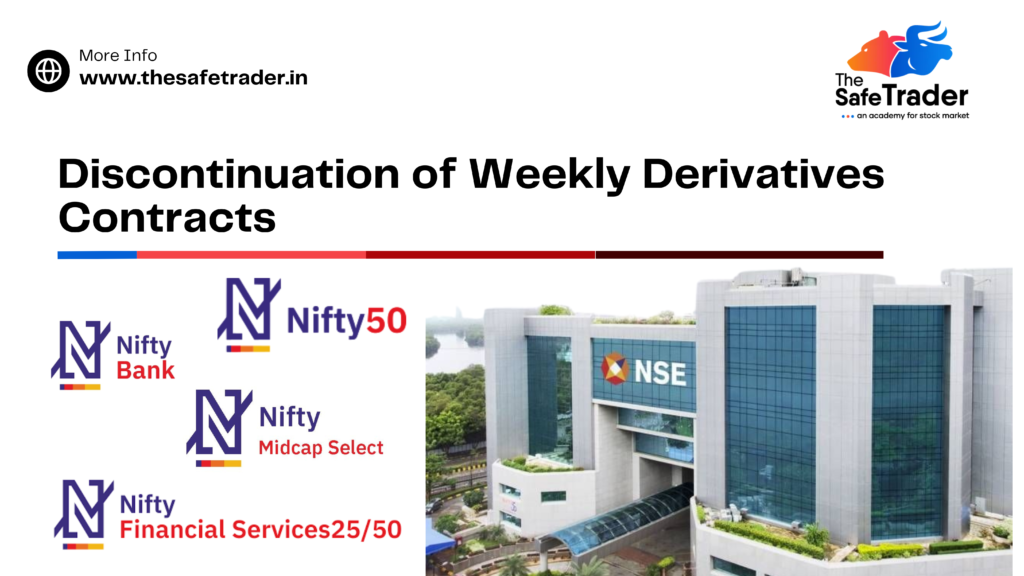
Discontinuation of Weekly Derivatives Contracts on Bank Nifty, Midcap Nifty, and FinNifty: A New Chapter in Indian Markets The Securities and Exchange Board of India (SEBI) has made a groundbreaking decision to discontinue weekly derivatives contracts for Bank Nifty, Midcap Nifty, and Finnifty indices, effective November 20, 2024. This move, aimed at protecting small traders from excessive losses, marks a significant shift in the trading landscape. The Indian financial markets are witnessing a paradigm shift as the SEBI introduces significant reforms to the derivatives trading segment. Let’s dive into the details. Why SEBI Took This Bold Step The SEBI’s decision stems from a stark reality: while derivatives trading has boomed in recent years, retail traders have borne the brunt of substantial losses. According to SEBI’s study, only 7.2% of individual traders profited in derivatives trading over the past three years, while the remaining 92.8% collectively lost a staggering ₹1.81 lakh crore between FY22 and FY24. This concerning trend prompted SEBI to introduce stricter regulations to: The Rise and Fall of Weekly Expiry Contracts Since their launch by the National Stock Exchange (NSE) in 2016, weekly expiry contracts—especially Bank Nifty—have been a cornerstone of India’s derivatives market. Retail traders were drawn to these contracts for their affordability, high liquidity, and potential for quick returns. By the first half of FY25, Bank Nifty alone accounted for nearly 47.5% of NSE’s weekly options premium turnover, reflecting its dominance. Key Highlights of the New Rules 4. Focus on Monthly Expiry Contracts With weekly options discontinued for popular indices, traders are expected to pivot towards monthly contracts, which are generally less volatile and provide a more stable trading environment. Impact on the Market Immediate Effects Impact on Traders and Brokers Long-Term Implications While the immediate reaction to these changes may involve reduced liquidity and trading volumes, experts believe the long-term outcomes could be positive: Farewell to Bank Nifty Weekly Options The Bank Nifty weekly contract has been a favorite among traders since its launch in 2016, driving significant growth in the derivatives market. Its discontinuation marks the end of an era, but also a new beginning for India’s financial markets. As SEBI pushes for a more structured and risk-conscious trading environment, the focus shifts from short-term gains to sustainable investment practices.Bank Nifty weekly options have been the cornerstone of NSE’s derivatives segment, celebrated for their liquidity and affordability. Over the years, they have attracted millions of retail traders, becoming synonymous with high-frequency trading. However, their high-risk nature led to outsized losses for retail participants, making them a focal point of SEBI’s reforms. The Bigger Picture: From Speculation to Wealth Creation SEBI’s regulatory changes signify a paradigm shift toward investor protection and long-term wealth creation. By steering traders away from speculative trading, the market watchdog aims to foster a culture of disciplined investment. Potential Benefits What’s Next for Traders? For active traders, the discontinuation of weekly expiry contracts represents both a challenge and an opportunity. Here’s what they can do: A New Chapter for the Indian Market The discontinuation of weekly derivatives contracts for Bank Nifty, Midcap Nifty, and Finnifty signals the end of an era. While it may initially disrupt trading strategies and volumes, SEBI’s proactive measures prioritize investor protection and long-term market health. As the market adapts to these changes, traders and brokers alike will need to rethink their approaches, paving the way for a more resilient and inclusive financial ecosystem. Conclusion The discontinuation of weekly derivatives contracts on Bank Nifty, Midcap Nifty, and FinNifty marks the end of an era and the beginning of a more regulated, investor-friendly market. While the short-term impact may be disruptive, SEBI’s measures aim to build a robust financial ecosystem that balances growth with risk management. As traders and investors navigate these changes, adaptability and a focus on long-term goals will be key to success in the new market landscape. Stay tuned as we explore the evolving landscape of India’s derivatives market in the coming months!
The Importance of Technical Analysis in Modern Stock Market Trading: A Must-Learn for Every Trader and Investor
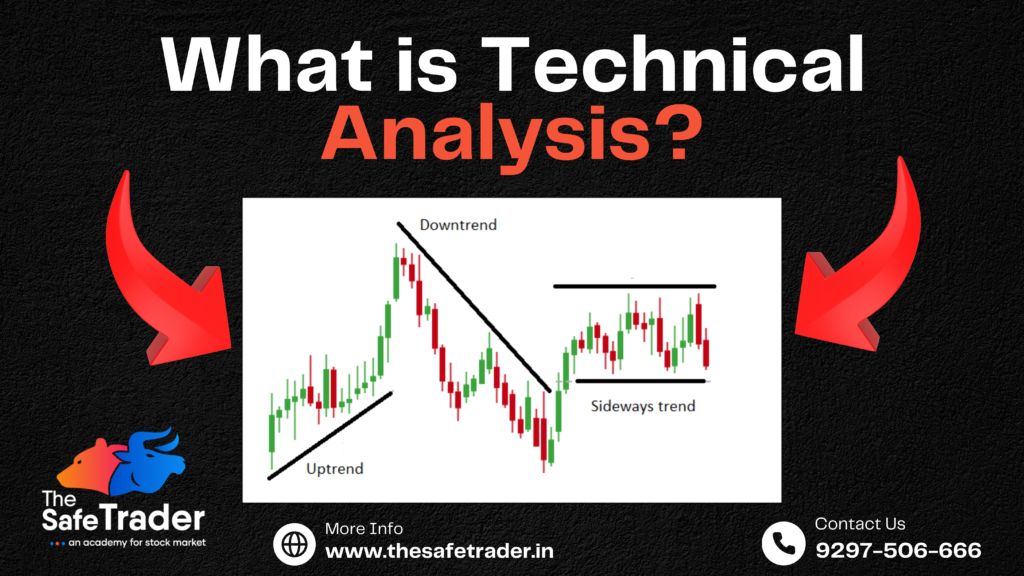
The Importance of Technical Analysis in Modern Stock Market Trading: A Must-Learn for Every Trader and Investor In today’s fast-paced financial markets, technical analysis has become an indispensable tool for traders and investors alike. With advancements in technology and the increasing complexity of financial instruments, learning modern techniques of technical analysis is not just a choice but a necessity for anyone serious about navigating the stock market effectively. What is Technical Analysis? Technical analysis is a method of evaluating financial markets by analyzing historical price movements, trading volumes, and patterns. Unlike fundamental analysis, which focuses on the intrinsic value of a stock, technical analysis is rooted in the belief that all market information is already reflected in the price. Traders use charts, indicators, and patterns to predict future price movements and identify optimal entry and exit points. Why Should Every Trader and Investor Learn Modern Techniques? Key Roles of Technical Analysis Advantages of Technical Analysis New Strategies in Technical Analysis Modern technical analysis incorporates advanced strategies, such as: How to Apply Technical Analysis in Trading Is Technical Analysis Essential? For traders, technical analysis is essential as it provides actionable insights for short-term decisions. For investors, understanding technical analysis can complement fundamental research, especially when timing market entries and exits. While it’s not a guarantee for success, it significantly increases the likelihood of making informed and profitable decisions. Should Every Investor and Trader Learn Modern Techniques? The short answer is: Yes. Modern trading has evolved with technology, and integrating advanced techniques has become more critical than ever. Here’s why: Will It Help You Enter at the Best Price? One of the biggest advantages of technical analysis is its ability to highlight optimal entry points. By understanding support levels, candlestick patterns, and momentum indicators, traders can enter trades at favorable prices and maximize their potential returns. Conclusion In the modern financial landscape, technical analysis is not just a skill but a necessity for anyone looking to succeed in the stock market. Whether you’re a novice or an experienced trader, mastering technical analysis can provide a significant edge. By leveraging its tools and strategies, you can make data-driven decisions, manage risk effectively, and control emotions, ultimately becoming a more confident and successful market participant. Start your journey with technical analysis today, and unlock the door to smarter and more strategic trading!
Types of Trading in the Stock Market
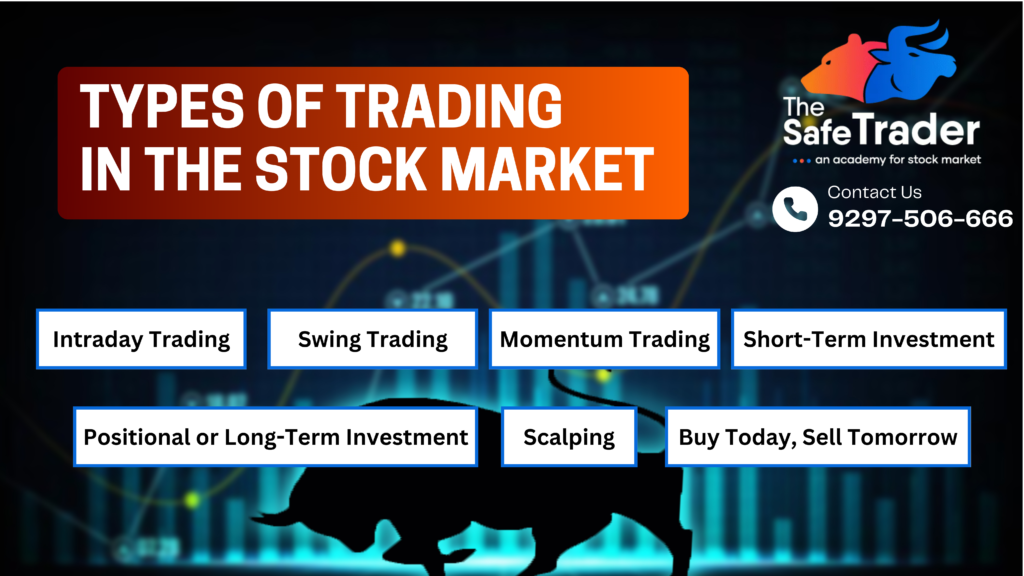
Trading in the stock market involves buying and selling shares with the intent to profit from market fluctuations. Different trading types cater to diverse strategies, timeframes, and goals, allowing investors to tailor their approach according to their risk tolerance, financial goals, and available time. Trading in the stock market offers a variety of styles, each suited to different risk appetites, time commitments, and market analysis approaches. Here’s a breakdown of some of the most popular trading methods, along with examples to help you understand each one better. 1. Intraday Trading Definition: Intraday trading, also known as day trading, involves buying and selling stocks within the same trading day. Traders do not hold positions overnight, aiming instead to profit from short-term price movements. Example: Suppose a trader buys shares of Company XYZ at ₹200 per share in the morning and sells them at ₹210 before the market closes. The ₹10 per share difference represents their intraday profit. Who It’s For: This approach is suitable for traders who can actively monitor the market throughout the day and are comfortable with quick decision-making. Risks: Intraday trading can be risky, as prices fluctuate throughout the day. It requires a strong grasp of technical analysis and market indicators. Characteristics: 2. BTST (Buy Today, Sell Tomorrow) Definition: BTST trading refers to buying shares today and selling them the next trading day without taking delivery. Traders aim to capitalize on short-term momentum, predicting that the stock price will rise the next day. Example: If a trader buys 100 shares of Company ABC on Monday at ₹150, they may plan to sell it on Tuesday if they anticipate a price rise based on news or technical indicators. Who It’s For: BTST is suitable for traders who want to capture overnight momentum without holding the stock long-term. Risks: Stock prices can gap down due to overnight events, so BTST trading involves a level of risk from price fluctuations between closing and opening prices. Characteristics: 3. Swing Trading Definition: Swing trading involves holding stocks for several days to weeks, aiming to profit from medium-term price fluctuations. Swing traders often rely on technical analysis to identify entry and exit points. Example: A trader buys shares of Company XYZ at ₹500, expecting the price to reach ₹550 over the next two weeks. Once the price target is achieved, the trader exits the trade. Who It’s For: This strategy suits traders who cannot monitor the market constantly but have a good understanding of technical indicators and patterns. Risks: Market volatility or unexpected news can disrupt the planned swing, potentially leading to losses if the trader is not able to adjust their position. Characteristics: 4. Short-Term Investment Definition: Short-term investing involves holding stocks for a few months to a year. Investors typically look for undervalued stocks that they believe will increase in value over the short term. Example: An investor buys shares of a pharmaceutical company ahead of expected approval for a new drug, hoping to see an increase in the stock price over six months. Who It’s For: Short-term investments are ideal for those who can wait a few months and have moderate risk tolerance, often relying on both technical and fundamental analysis. Risks: Short-term investments can be affected by quarterly earnings, regulatory changes, and sector-specific news, which might lead to volatility. Characteristics: 5. Positional or Long-Term Investment Definition: Positional or long-term investing involves holding stocks for several years, often based on fundamental analysis. Long-term investors look for growth companies or blue-chip stocks that can appreciate in value over time. Example: An investor buys shares of a large tech company with a solid track record and holds onto it for five years, during which the stock value grows significantly due to the company’s consistent growth and innovation. Who It’s For: This approach is for investors with a long-term horizon and a high tolerance for market fluctuations, as they are prepared to weather short-term volatility for the potential of larger gains. Risks: Long-term investments are susceptible to market cycles, economic downturns, and industry shifts that could affect the company’s growth over the years. Characteristics: 6. Momentum Trading Definition: Momentum trading involves buying stocks that are showing strong upward trends and selling them when the momentum begins to fade. This style of trading relies heavily on market sentiment and technical indicators like moving averages. Example: A momentum trader notices that Company XYZ’s stock has been gaining steadily for the past month, driven by strong quarterly earnings. They buy shares, expecting the upward trend to continue, and sell once indicators show that the momentum is slowing. Who It’s For: This approach is suitable for traders who closely follow technical indicators and are comfortable taking on moderate risk in pursuit of quick profits. Risks: Momentum trading can be risky if the trend reverses unexpectedly, leading to potential losses for those unable to exit quickly. Characteristics: 7. Scalping Definition: Scalping is a fast-paced trading strategy where traders aim to make small, quick profits from tiny price changes. Scalpers may make dozens or even hundreds of trades in a single day, closing each position within minutes or even seconds. Example: A scalper buys shares of Company ABC at ₹150.01 and sells them a few seconds later at ₹150.05. While the profit per share is small, repeating this process multiple times can add up to significant gains. Who It’s For: Scalping is for traders who are highly disciplined, quick at executing trades, and have the ability to focus intensely for extended periods. Risks: Scalping requires substantial knowledge of the market and rapid decision-making skills. High transaction costs and minor missteps can erode profits quickly. Characteristics: Choosing the Right Trading Style The right trading style depends on your risk tolerance, time availability, and trading knowledge. Here’s a summary to help you decide: Each style has unique advantages and challenges, so understanding your financial goals, risk tolerance, and available time is crucial. Remember that no single style guarantees success, and continuous learning and practice are essential for any trader. Whether you’re
The Difference Between Trading and Investing: A Guide for Beginners

The financial markets have always attracted individuals seeking to grow their wealth, but there’s often confusion about the difference between trading and investing. In this article, we’ll break down what sets these two approaches apart, the unique benefits and risks of each, and how to decide which might be best suited for your financial goals. Introduction to Trading and Investing Trading and investing are terms frequently used interchangeably, but they signify distinct strategies for building wealth. While both revolve around buying and selling assets to generate returns, the key difference lies in the time horizon and the approach to risk and reward. What is Trading? Trading is the practice of buying and selling financial instruments, such as stocks, commodities, currencies, or derivatives, within a short time frame. The goal of trading is to make quick profits by capitalizing on short-term price fluctuations. Key Characteristics of Trading What is Investing? Investing, on the other hand, is about purchasing assets to hold them for the long term, typically years or even decades. The objective of investing is to grow wealth gradually over time by capitalizing on the asset’s potential appreciation and compounding growth. Investing is a strategy focused on building wealth over the long term by purchasing assets and holding them with a long-term horizon. Investors purchase stocks, bonds, real estate, or mutual funds to achieve gradual growth over several years or even decades. The goal of investing is not just to generate capital appreciation but also to receive dividends, interest, or rental income over time. Types of Investing Key Characteristics of Investing Comparing Trading and Investing Types of Traders and Investors Both trading and investing have subcategories that suit different personalities, lifestyles, and risk tolerances. Types of Traders Types of Investors Benefits and Drawbacks of Trading Benefits of Trading Drawbacks of Trading Benefits and Drawbacks of Investing Benefits of Investing Drawbacks of Investing Which is Right for You? Trading or Investing? Choosing between trading and investing depends on various factors: Who Should Consider Trading? Trading is ideal for those who: Who Should Consider Investing? Investing is suitable for individuals who: The Importance of Understanding Your Financial Goals To determine whether trading or investing is the right fit for you, it’s essential to understand your financial goals, risk tolerance, and time horizon. If you’re seeking high returns in a short period and are comfortable with risk, trading could be the path for you. On the other hand, if you’re aiming for consistent growth over time without actively managing your portfolio every day, investing is the way to go. Both trading and investing have their merits and drawbacks, and many successful market participants use a combination of both strategies to diversify their approaches and mitigate risks. Ultimately, your personal circumstances, time availability, and financial objectives will dictate which approach—or blend of both—suits you best. Blending Trading and Investing Strategies Some people prefer a hybrid approach, where they invest a portion of their portfolio for the long-term and trade with another portion to capitalize on short-term opportunities. This approach provides a balance between the growth potential of investing and the active gains of trading. Final Thoughts: Making an Informed Decision Both trading and investing offer viable paths to financial growth but cater to different styles and risk profiles. Trading can yield high returns quickly but comes with substantial risk, while investing provides stable growth over time with lower exposure to volatility. Ultimately, the best approach depends on individual goals, risk tolerance, and commitment. If you’re new to the financial markets, consider starting with small investments or trading simulations to understand the dynamics before committing significant capital. Consulting with financial advisors and continuous learning are also essential as both trading and investing involve complex knowledge and strategies. In today’s digital era, it’s easier than ever to access the tools and information needed to trade or invest. While both trading and investing can be profitable, their strategies, risks, and benefits are distinctly different. For those new to financial markets, The Safe Trader Academy in Hyderabad offers resources, training, and guidance. Whether you want to dive into trading strategies or learn investment fundamentals, The Safe Trader Academy provides valuable support to help you achieve your financial aspirations. FAQs
Derivative Trading: A Comprehensive Guide
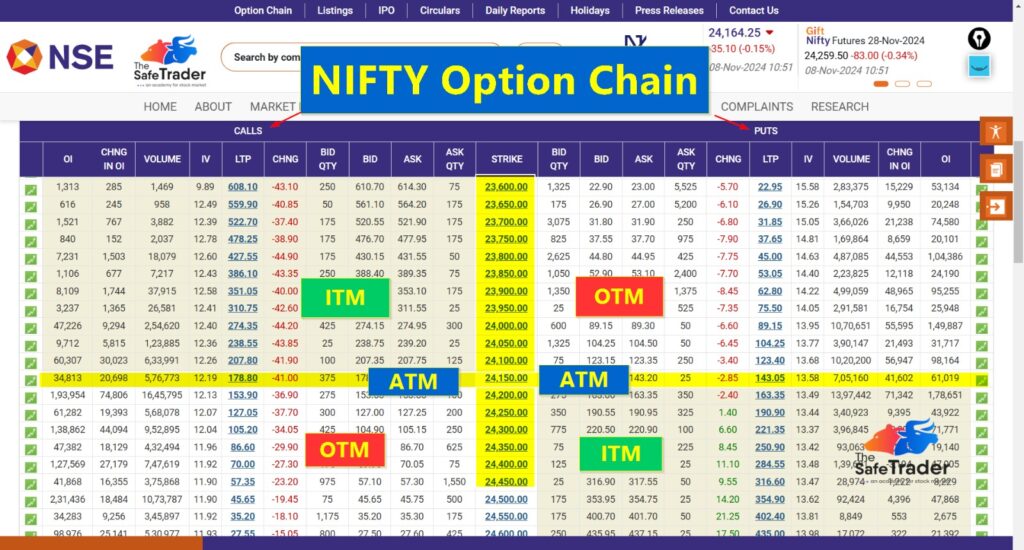
Derivative Trading: A Comprehensive Guide What is Derivative Trading? In the Indian stock market, derivative trading has become an essential tool for traders and investors looking to manage risk and enhance their portfolio’s performance. Here at The Safe Trader Academy, Hyderabad, we specialize in equipping you with the knowledge and skills to navigate the complex world of derivatives trading with confidence. Our NISM-certified trainers bring extensive experience in equity, futures, options (F&O), and commodity trading, offering a comprehensive curriculum designed for both beginners and experienced traders. Derivative trading involves contracts whose value is derived from an underlying asset. This underlying asset can be anything from stocks and commodities to currencies and indices. Derivatives provide a unique opportunity to speculate on market movements without directly owning the underlying asset. Types of Derivatives: What is an Option? Options are a type of derivative contract that gives the buyer the right (but not the obligation) to buy or sell an underlying asset at a predetermined price within a specific timeframe. Types of Options In the world of options trading, there are two primary types of options: calls and puts.A call option gives the buyer the right to purchase the asset, while a put option gives them the right to sell it. Call Option: The right to buy an asset at a specified price. Put Option: The right to sell an asset at a specified price. 2. Futures: Contracts that obligate the buyer to purchase and the seller to sell an asset at a predetermined price on a future date. These instruments include futures, options, forwards, and swaps. What is a Future? A futures contract is a derivative agreement to buy or sell an asset at a future date for a specified price. Futures are commonly used by investors to hedge risk or speculate on the direction of an asset’s price. What is Open Interest in Future Trading? Open Interest (OI) refers to the total number of outstanding derivative contracts, such as options or futures, that have not been settled. OI is crucial in gauging the strength of a price trend in futures trading. Key Concepts This indicates an increase in OI and price, suggesting bullish sentiment in the market. An increase in OI accompanied by a decrease in price, often signaling bearish sentiment. When traders start closing long positions, leading to a drop in both price and OI. This happens when traders close short positions, which can push the price higher as the OI decreases. What is an Option Chain? An option chain, also known as an options matrix, displays all available strike prices and premiums for a specific underlying asset. It provides a snapshot of call and put options, helping traders analyze market sentiment, volatility, and price expectations. A table showing the options available for a particular underlying asset, including strike prices, expiry dates, and their respective premiums. Key Metrics in Option Chain Analysis: What is Put-Call Ratio (PCR)?The PCR is a sentiment indicator that compares the trading volume of put options to call options. A high PCR indicates a bearish sentiment, while a low PCR indicates a bullish sentiment. Importance of Volume and Strike Price Selection In-the-money, at-the-money, and out-of-the-money strike prices each have their advantages. Identifying Support & Resistance using OI Data:Traders use OI data to identify key support and resistance levels. High OI at a particular strike price indicates strong support or resistance. By analyzing OI at various strike prices, traders can identify significant support and resistance levels. High OI at a particular strike price suggests a strong barrier that the price may struggle to break. Who are Options Writers/Sellers? Options writers, or sellers, are traders who write (or sell) options contracts, earning the premium paid by the buyer. Options writers are obligated to fulfill the contract if the buyer exercises their option. Options writers, also known as sellers, are market participants who create and sell option contracts. They generally have deeper pockets compared to option buyers. Where Can I Get the Latest OI Data During Market Hours? Real-time OI data is available through various financial platforms and brokerage services. Access to up-to-date OI information is critical for making informed trading decisions. Why Choose The Safe Trader Academy? At The Safe Trader Academy, we pride ourselves on our team of NISM-certified professionals, including Equity F&O Traders, Commodity Derivatives Traders, Investment Advisors, and Research Analysts. Our group of seasoned traders and trainers is dedicated to providing top-notch stock market training in Hyderabad and beyond. Embark on your journey to financial mastery with The Safe Trader Academy. Our tailored programs and expert trainers are here to guide you every step of the way in the exciting world of derivative trading.
Muhurth Trading on Diwali: Significance and Tradition

The annual tradition of Muhurat Trading is one of the most anticipated events in the Indian stock market, especially for investors who believe in the auspiciousness of Diwali. On November 1, 2024, from 6:00 PM to 7:00 PM, the Bombay Stock Exchange (BSE) and the National Stock Exchange (NSE) will hold their hour-long Muhurat Trading session, marking the beginning of the Hindu calendar year, Samvat 2081. This special session has both spiritual and financial significance, drawing a blend of faith and finance that goes back centuries. At The Safe Trader Academy, we celebrate the festival of Diwali every year with joy and enthusiasm. As part of our tradition, we invite all of you to join us in this celebration of wealth and prosperity. This is the perfect opportunity to start your investment journey on the auspicious occasion of Muhurth Trading. Let’s come together to make the most of this festival and begin a prosperous financial year with the blessings of Goddess Lakshmi. The Significance of Muhurat Trading ‘Muhurat’ refers to a “auspicious moment,” a time period deemed favorable by Vedic astrology for new beginnings. In the financial world, it translates to a symbolic opening for wealth creation, prosperity, and growth. Muhurat Trading on Diwali holds a deep-rooted significance in the Hindu tradition, as it aligns with the start of the new Samvat, the Hindu calendar year. Many believe that the trades initiated during this hour will bring good fortune throughout the year. For investors, particularly those with a religious or cultural inclination, it is more than just a trading session. It represents a fresh beginning, reflecting on past financial performance and looking forward to new opportunities. Many traders and investors consider this the perfect time to start their investment journey, fueled by the belief that starting ventures on this day attracts wealth, success, and good luck. Why Do People Start Investing on Diwali According to the Hindu Calendar? Diwali is one of the most important festivals in the Hindu religion, celebrated as the victory of light over darkness and good over evil. The festival symbolizes new beginnings, and in the context of wealth, it is linked to the worship of Goddess Lakshmi, the deity of wealth and prosperity. It is believed that making investments or starting new ventures on Diwali invokes the blessings of Lakshmi, ensuring financial growth. The Hindu calendar plays a pivotal role in determining auspicious days for starting significant ventures, and Diwali marks the start of the new financial year for many in the business community. This concept of a new beginning aligns with the belief that Samvat marks a fresh cycle in the cosmos, creating a positive environment for success in financial matters. Rituals and Traditions Surrounding Muhurat Trading Several rituals are conducted during this special session, adding to its cultural and spiritual depth. Traders often begin the day with a prayer to Lord Ganesha, the remover of obstacles, and Goddess Lakshmi for prosperity. Many families and trading firms buy a small quantity of stocks as a symbolic gesture, emphasizing the idea of growth and success in the coming year. Over time, while the stock market has become more technologically driven and globalized, this ancient tradition has managed to keep its charm. For seasoned traders and first-time investors alike, the Muhurat Trading session is an opportunity to participate in the market with a positive mindset, hoping for a prosperous year ahead. The Importance of Muhurth Trading Why Do People Start Investing on Diwali According to the Hindu Calendar? According to the Hindu calendar, Diwali marks the end of the harvest season and the start of the new financial year, particularly for the business community in many regions of India. This period is associated with new beginnings, prosperity, and removing obstacles from one’s financial path. Conclusion Muhurth Trading during Diwali is not just about participating in the stock market; it’s about embracing new financial opportunities with optimism, grounded in cultural and spiritual beliefs. As the BSE and NSE host this annual session on November 1, 2024, it marks not only the start of Samvat 2081 but also the belief in the power of auspicious beginnings. By participating, traders align themselves with a centuries-old tradition that blends faith, finance, and fortune, hoping to bring wealth and success into their lives for the new year ahead.
Every Trader must know this software Comprehensive Trading Platform for Traders: Features and Benefits
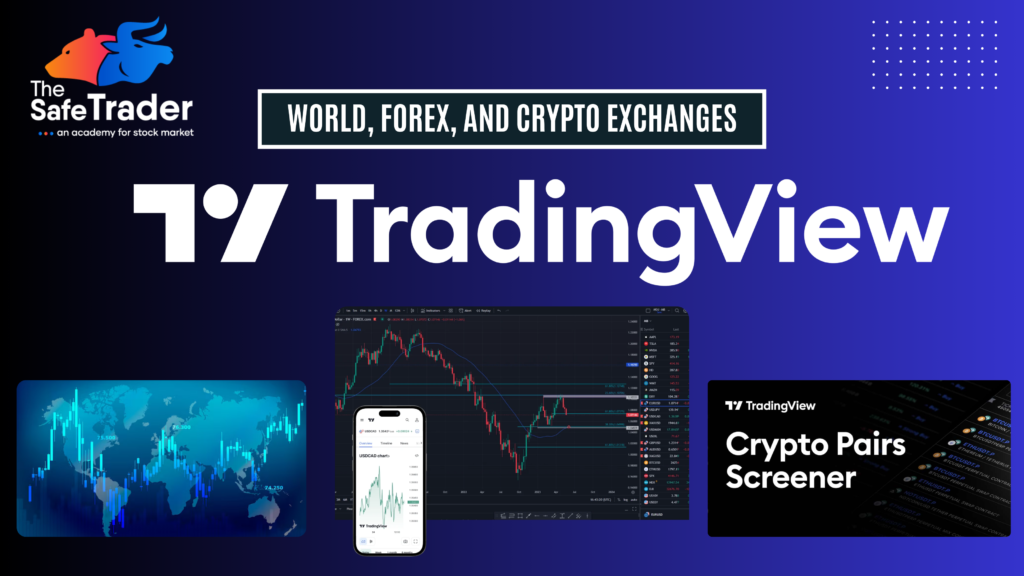
In today’s fast-paced financial markets, traders and investors need access to advanced tools and real-time data to make informed decisions. Whether you’re a novice or an expert, having a powerful trading platform with extensive features can elevate your trading experience. This article dives into the essential features of a trading platform, showcasing everything from alerts to comprehensive financial analysis and how it supports your trading journey.
SEBI Study: 93% of Individual Traders Face Losses in Equity F&O from FY22 to FY24, ₹1.8 Lakh Crore Aggregate Losses
SEBI Study: 93% of Individual Traders Face Losses in Equity F&O from FY22 to FY24, ₹1.8 Lakh Crore Aggregate Losses
By investing ₹15,000 monthly for 15 years in Mutual Fund SIP+SWP you can earn up to ₹70,000 monthly income for decades; how is it possible?
Systematic Investment Plan (SIP) can help one build a sizeable retirement corpus with the help of constant investing in the long term. Though systematic withdrawal (SWP), one can withdraw that money in phases to secure monthly income. Systematic Investment Plan (SIP): Systematic Withdrawal Plan (SWP): SIP+SWP: SIP investment in a mutual fund can be an effective way to build a large retirement corpus in the long term. If picks mutual fund keeping in mind growth in the long term, reshuffle non-performing mutual funds on a constant basis, their investment can grow at a pace of 12 percent annually or above. On the other hand, if they don’t want to withdraw that amount in one go and want it in phases, they can start a systematic withdrawal plan (SWP), where they can get monthly income in the form of principal amount and return. In this write-up, know how Rs 15,000 monthly SIP can help one build over a Rs 1 crore corpus in 16 years, and after that, how they can withdraw Rs 70,000 monthly income from that for decades. Disclaimer: https://thesafetraderacademy.com/sebi-disclaimer/ Our calculations are projections and are not investment advice. Do your own due diligence or consult an expert before investing. 1/11 What is SIP? SIP is a method of investing in mutual funds. It allows you to invest in a mutual fund scheme at a regular interval. You can choose a yearly, monthly, or daily SIP to invest in. You don’t need a large amount to invest through SIP. It starts with Rs 100, and most mutual funds have Rs 500 as the minimum SIP investment. Even if you invest a small amount for a long period of 15 years and above, the SIP investment can help you generate good returns. SIP works on the rupee cost averaging concept. The price of net asset value (NAV), the basic unit of a mutual fund scheme, keeps changing with the ups and downs of the market. So, you purchase NAV at different rates in different investment periods. It can help beat market volatility in the long run and maximize investments. 2/11 What is SWP? It is opposite to SIP. Here, instead of investing at a prefixed interval, you withdraw money. The only difference is that you invest a lump sum amount in a mutual fund scheme to start SWP. The idea is you get growth on your investment, plus there is already the principal amount. So, one gets the mix of both in the form of a fixed income amount. If your rate of growth is higher than your rate of withdrawal, not only the SWP plan can help you get regular income, but also the value of your fund will grow. SWP is also based on rupee cost averaging basis. Here, the mutual fund house sells your NAV every withdrawal period. So, if the market is high and the cost of NAV is also high, the fund house will sell fewer NAVs for a prefixed amount. 3/11 How to build over Rs 1 crore corpus in 15 years There can be many ways to build Rs 1 crore corpus, but we will set a target of 16 years. So, the idea is to invest a Rs 15,000 SIP for 16 years and get a 15 percent annualized return. In equity mutual funds, 12 percent annualized returns are not tough to get in the long run. But a good mix of mutual funds and reshuffling of non-performing mutual funds can help you generate returns of 15 percent. 4/11 What will be your retirement corpus amount? So, with that strategy, in 16 years, you can generate an estimated corpus of Rs 1,08,26,619 in 16 years, of which Rs 28,80,000 will be your investments and Rs 79,46,619 will be estimated long-term gains. 5/11 What do you need to do? You may invest that money in equity, hybrid, and debt funds. But since you need regular income on retirement and may not want to take risk with your money, you can pick a conservative hybrid, balanced hybrid, or a debt fund, where you get at least 8 percent annualized return. 6/11 How to get Rs 60,000 monthly income? As per SWP calculator, if you draw Rs 60,000 monthly income with Rs 1,08,26,619 and get 8 percent annualized return on your investments, then even after withdrawing the same pension for 40 years, or a total withdrawal of 2,88,00,000, you will have the balance worth of Rs 5,19,41,824. 7/11 How to get Rs 60,000 monthly income? It means, instead of Rs 60,000, you can go for a higher monthly income, or you can start with Rs 60,000 and increase the monthly income limit as inflation rises. 8/11 What if I withdraw Rs 70,000 a month? Given the same condition, if you withdraw Rs 70,000 a month, you can withdraw the amount for 40 years. 9/11 What if I withdraw Rs 70,000 a month? After that period, your total withdrawal will be Rs 3,36,00,000, and the estimated balance worth will be Rs 1,67,99,011. 10/11 What if I withdraw Rs 75,000 a month? Even then, your investment can give you Rs 75,000 monthly income for 39 years, and the estimated balance amount after that will be Rs 1,54,732. 11/11 What if I withdraw Rs 75,000 a month? The withdrawal amount after 40 years of Rs 75,000 monthly income for 39 years will be Rs 3,51,00,000.