Understanding Support and Resistance is one of the foundational concepts in any Trading Strategy. Support-resistance identification is among the primary tools used by traders and investors to identify high-probability opportunities. When you know how to identify these levels, you can make better decisions while managing your risks. Being able to work with support and resistance will definitely improve your trading results.
Understanding Support & Resistance: The Basics Every Trader Must Know
What Are Support & Resistance?
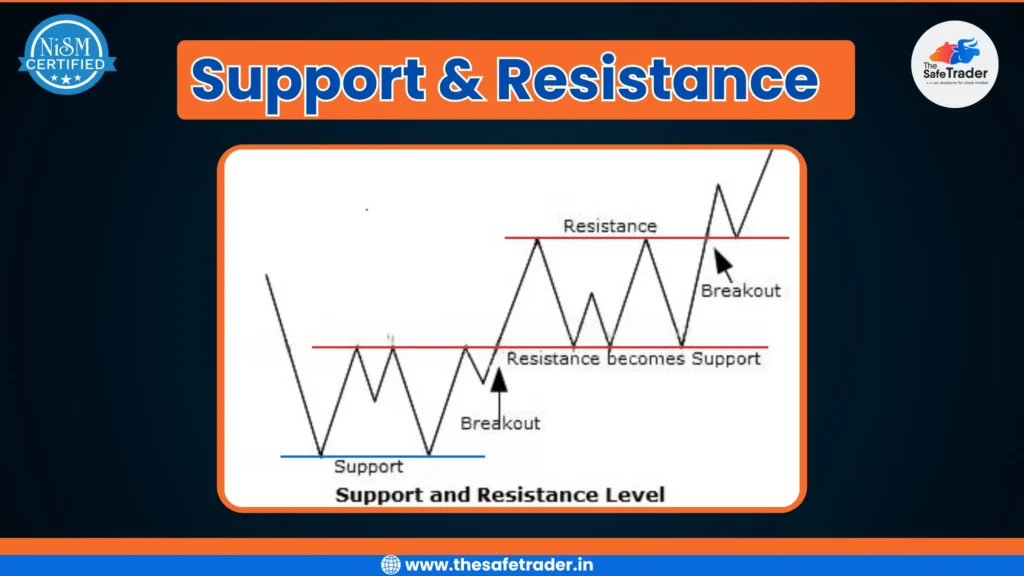
Support is a price level where buyers tend to jump in, preventing the price from dropping further. Think of support as a floor that keeps prices from falling below. Resistance is the opposite; it’s a price level where sellers emerge, stopping prices from climbing higher. It acts like a ceiling that holds prices back.
Naturally, these levels come into existence by the actions of a lot of people, applying their interpretations of what they see in the market. Supply-demand situations and psychology are two driving forces behind it. When an enormous number of traders believe that a certain level will hold, it does create a self-fulfilling prophecy.

The Significance of Support and Resistance in Trading
Support and resistance levels act as mental barriers for traders. They shape how traders view possible market turns. Most successful traders keep an eye on these levels to catch reversals or breakouts before they happen. Statistically, about 80% of market reversals happen near these key levels. Experts agree that support and resistance are vital for planning trades.
How Support & Resistance Levels Are Identified
Chart Based Techniques
The easiest way of finding support and resistance is by going through price charts and analyzing them. Look for regions where the price touches the level multiple times but fails to break through them. These levels are usually marked by horizontal lines, trendlines, or round numbers. With time, it makes zones that traders closely monitor.
Technical Indicators and Tools
To further confirm support/resistance levels, various tools could be used, including moving averages, Fibonacci retracements, and pivot points. Moving averages give the average prices for a given time and usually act as dynamic possible support or resistance. Fibonacci Levels give some ratios considered important and tell where the price may bounce. Pivot Points are calculated using prices of earlier days and give possible turning points.
Confirming Support & Resistance
Don’t just rely on a visual analysis. Wait for confirmation of support and resistance in the form of specific candlestick patterns like hammer or engulfing candles, a volume spike, or an unexpected price gap. Such hints will help you identify false breakouts when price only dips or jumps temporarily.
Practical Applications of Support & Resistance for Traders and Investors
Entry and Exit Strategies
Support and resistance help determine when may be good times to buy or sell. A bounce off support may provide a great buy point. When the price is hitting resistance, it may be a good time to sell. A breakout happens when the price pushes beyond a level, with traders watching these events to rake in quick profits.
Stop-Loss and Take-Profit Orders
Smart traders will place stop-loss orders just below support or above resistance, limiting their losses. E.g., suppose you bought at support; then, setting a stop-loss just below that level ensures you don’t get wiped out from a sharp fall. Targets for profit should be near the next support or resistance, allowing you to get away with your gain easily.
Managing Risk and Improving Trade Probability
Support and resistance levels assist you in weighing risk versus reward. A trade that is stopped close to support and giving higher chances of gain near resistance has higher chances of winning. Think of these levels as nets to help you catch smarter trades.
How It Helps Investors
While traders focus on short-term movements, investors use support and resistance to:
- Buy During Dips (Value Investing):
- Buying near strong support levels allows investors to enter at relatively lower prices.
- Buying near strong support levels allows investors to enter at relatively lower prices.
- Avoid Buying at Overvalued Levels:
- Resistance zones help investors avoid buying at peaks where the price might reverse.
- Resistance zones help investors avoid buying at peaks where the price might reverse.
- Long-Term Trend Confirmation:
- If a stock repeatedly holds above long-term support or breaks major resistance, it shows strength and growth potential.
- If a stock repeatedly holds above long-term support or breaks major resistance, it shows strength and growth potential.
Limitations and Common Challenges
False Breakouts and Whipsaws
The price, at times, appears to break the support or resistance and then suddenly reverses. Such false signals bait traders into wrong trades. To avoid such mistakes, one must wait for confirmation such as volume spike or candle patterns.
Dynamic Nature of Support & Resistance
The levels are not set in stone; they evolve with the market. A support zone may become resistance in a week’s time. Therefore, stay alert and refresh your levels on an hourly basis.
Combining Support & Resistance with Other Indicators
Other indicators like oscillators or trend indicators help to increase accuracy. For example, volume analysis aids in confirming a legitimate breakout. By combining multiple signals, one can get a clearer picture and save themselves from bad trades.
Advanced Concepts and Tips for Effective Use
Trading Strategies Focused on Support & Resistance
There are various methods for trading around support and resistance. Breakout trading intends to exploit strong price actions beyond these levels. Bounce trades are conducted by buying at support levels or selling at resistance levels. Range trades are executed between support and resistance to buy low and sell high within the channel.
Using Multiple Timeframes
Looking for support and resistance at different time frames just strengthens your analysis. Support on a daily chart might be more reliable than support on a 5-minute chart. Hence, long-term levels do hold more weight, with short-term levels signaling quick trade.
How It Helps in Strategy Building
✅ For Traders:
- Enhances decision-making for entry & exit
- Improves risk management by placing stop-loss orders just below support or above resistance
- Useful in forming breakout and reversal strategies
✅ For Investors:
- Identifies favorable buying zones
- Helps avoid buying in overbought regions near resistance
- Enables strategic profit-booking
Conclusion
Support and Resistance are two fundamental pillars in Technical Analysis. They help you identify high-probability trade setups and manage risk. Spotting these levels accurately allows you to plan better entries, exits, and stop-loss placements. Remember, support and resistance are not perfect—they shift and evolve over time. Continuous learning, disciplined trading, and combining them with other tools make these levels powerful for consistent success. Keep practicing, stay alert, and let support and resistance guide your way to smarter trading.